General Motors (NYSE: GM) has given shareholders a large capital-return headline and a harder operating question. A repurchase authorization can change the share count over time, but it cannot make rising production costs disappear.
On October 20, 2026, GM announced a new $20 billion multi-year share repurchase authorization. Its third-quarter release reported $50.0 billion in revenue, $3.3 billion in net income attributable to stockholders and $4.1 billion in adjusted EBIT. Those are different measures: adjusted EBIT is not net income or cash available for distribution.
What the buyback authorizes
GM says the program has no expiration date and may be suspended or discontinued. Authorization therefore does not mean the entire amount has already been spent. Investors should distinguish board permission, actual purchases and the resulting share count.
A repurchase can reduce shares outstanding, which can affect earnings per share even when total earnings follow a different path. The useful follow-up is to compare the company’s actual spending, business investment and financial flexibility. A big authorization is a capital-allocation decision, not a guaranteed investment return.
Why operating costs still matter
Reuters reported that GM faced higher commodity costs and fewer truck deliveries ahead of redesigned pickup launches. That puts the business question alongside the buyback: how much profit can the company retain from the vehicles it sells?
For consumers, a vehicle is both a product and a household commitment. For investors, the price customers pay must be considered alongside the costs of building and delivering that vehicle. Strong demand and a generous shareholder program do not eliminate the need to examine operating performance.
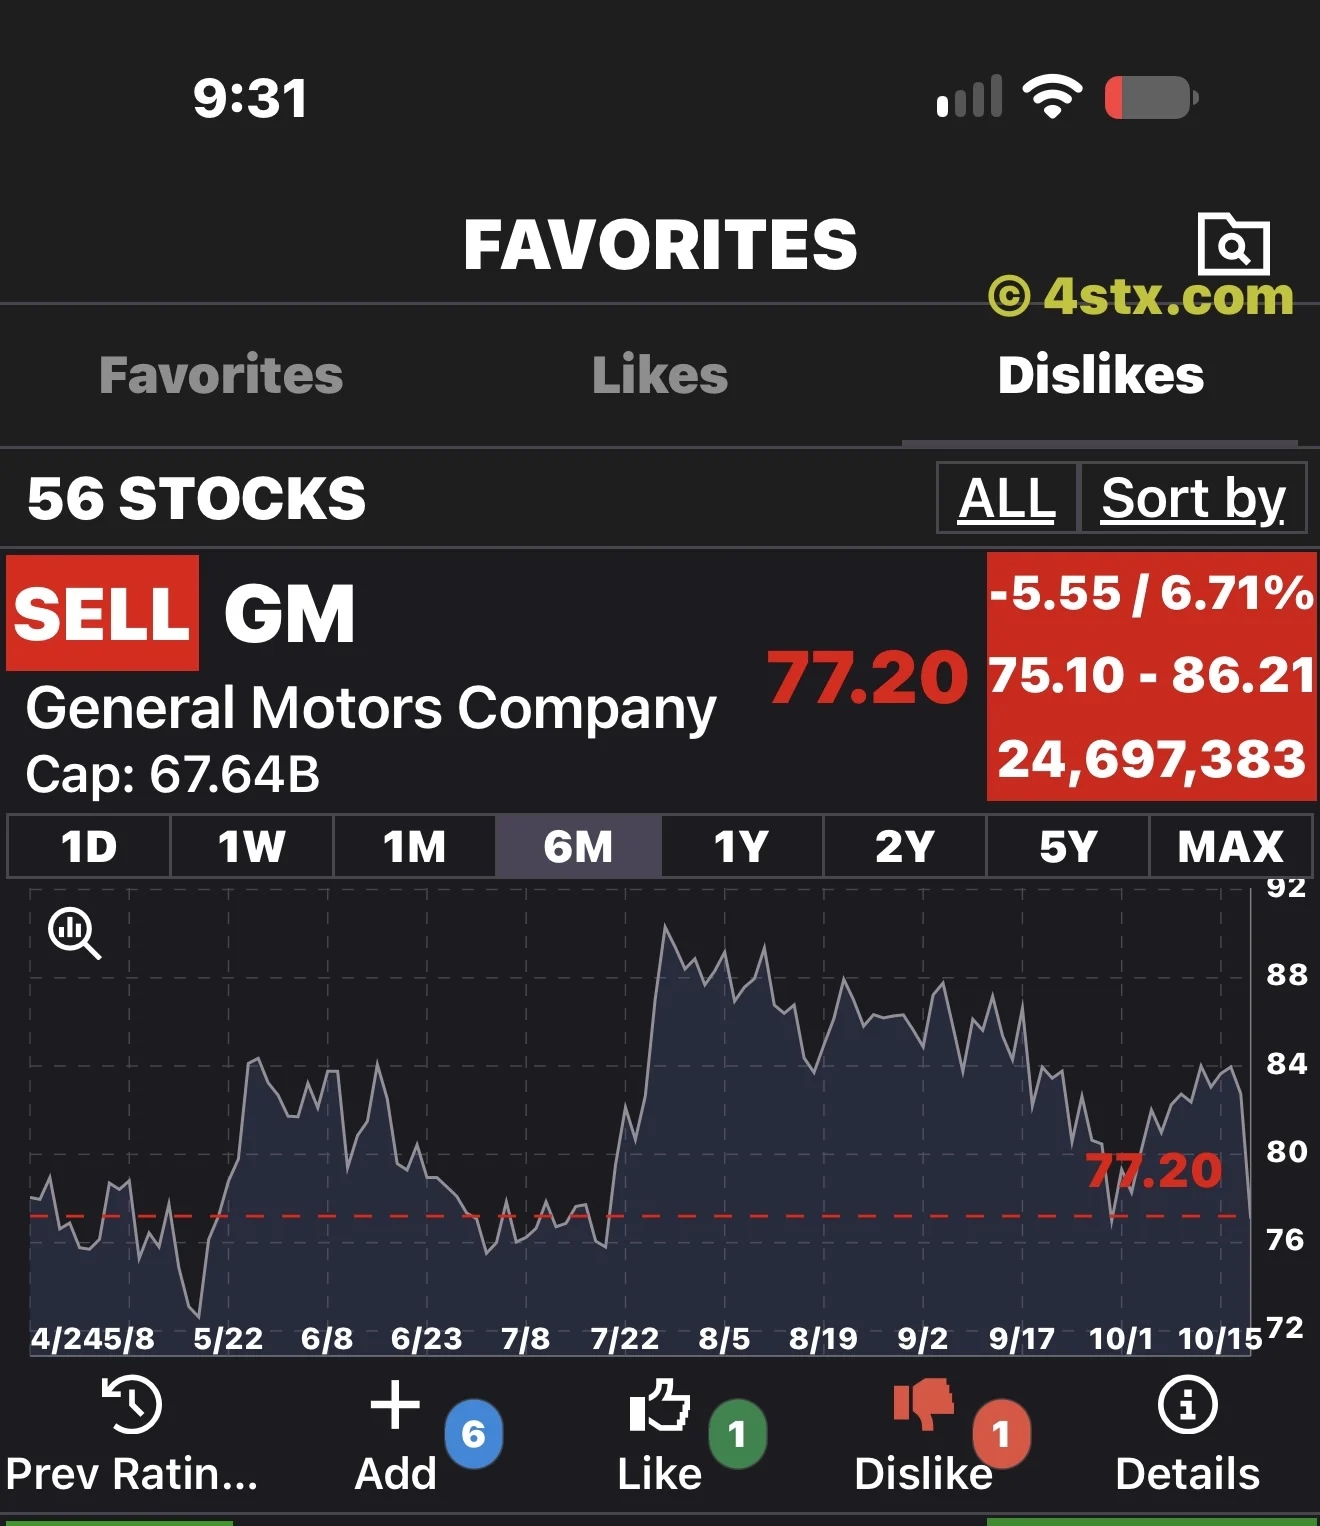
Start with the six-month chart and quote
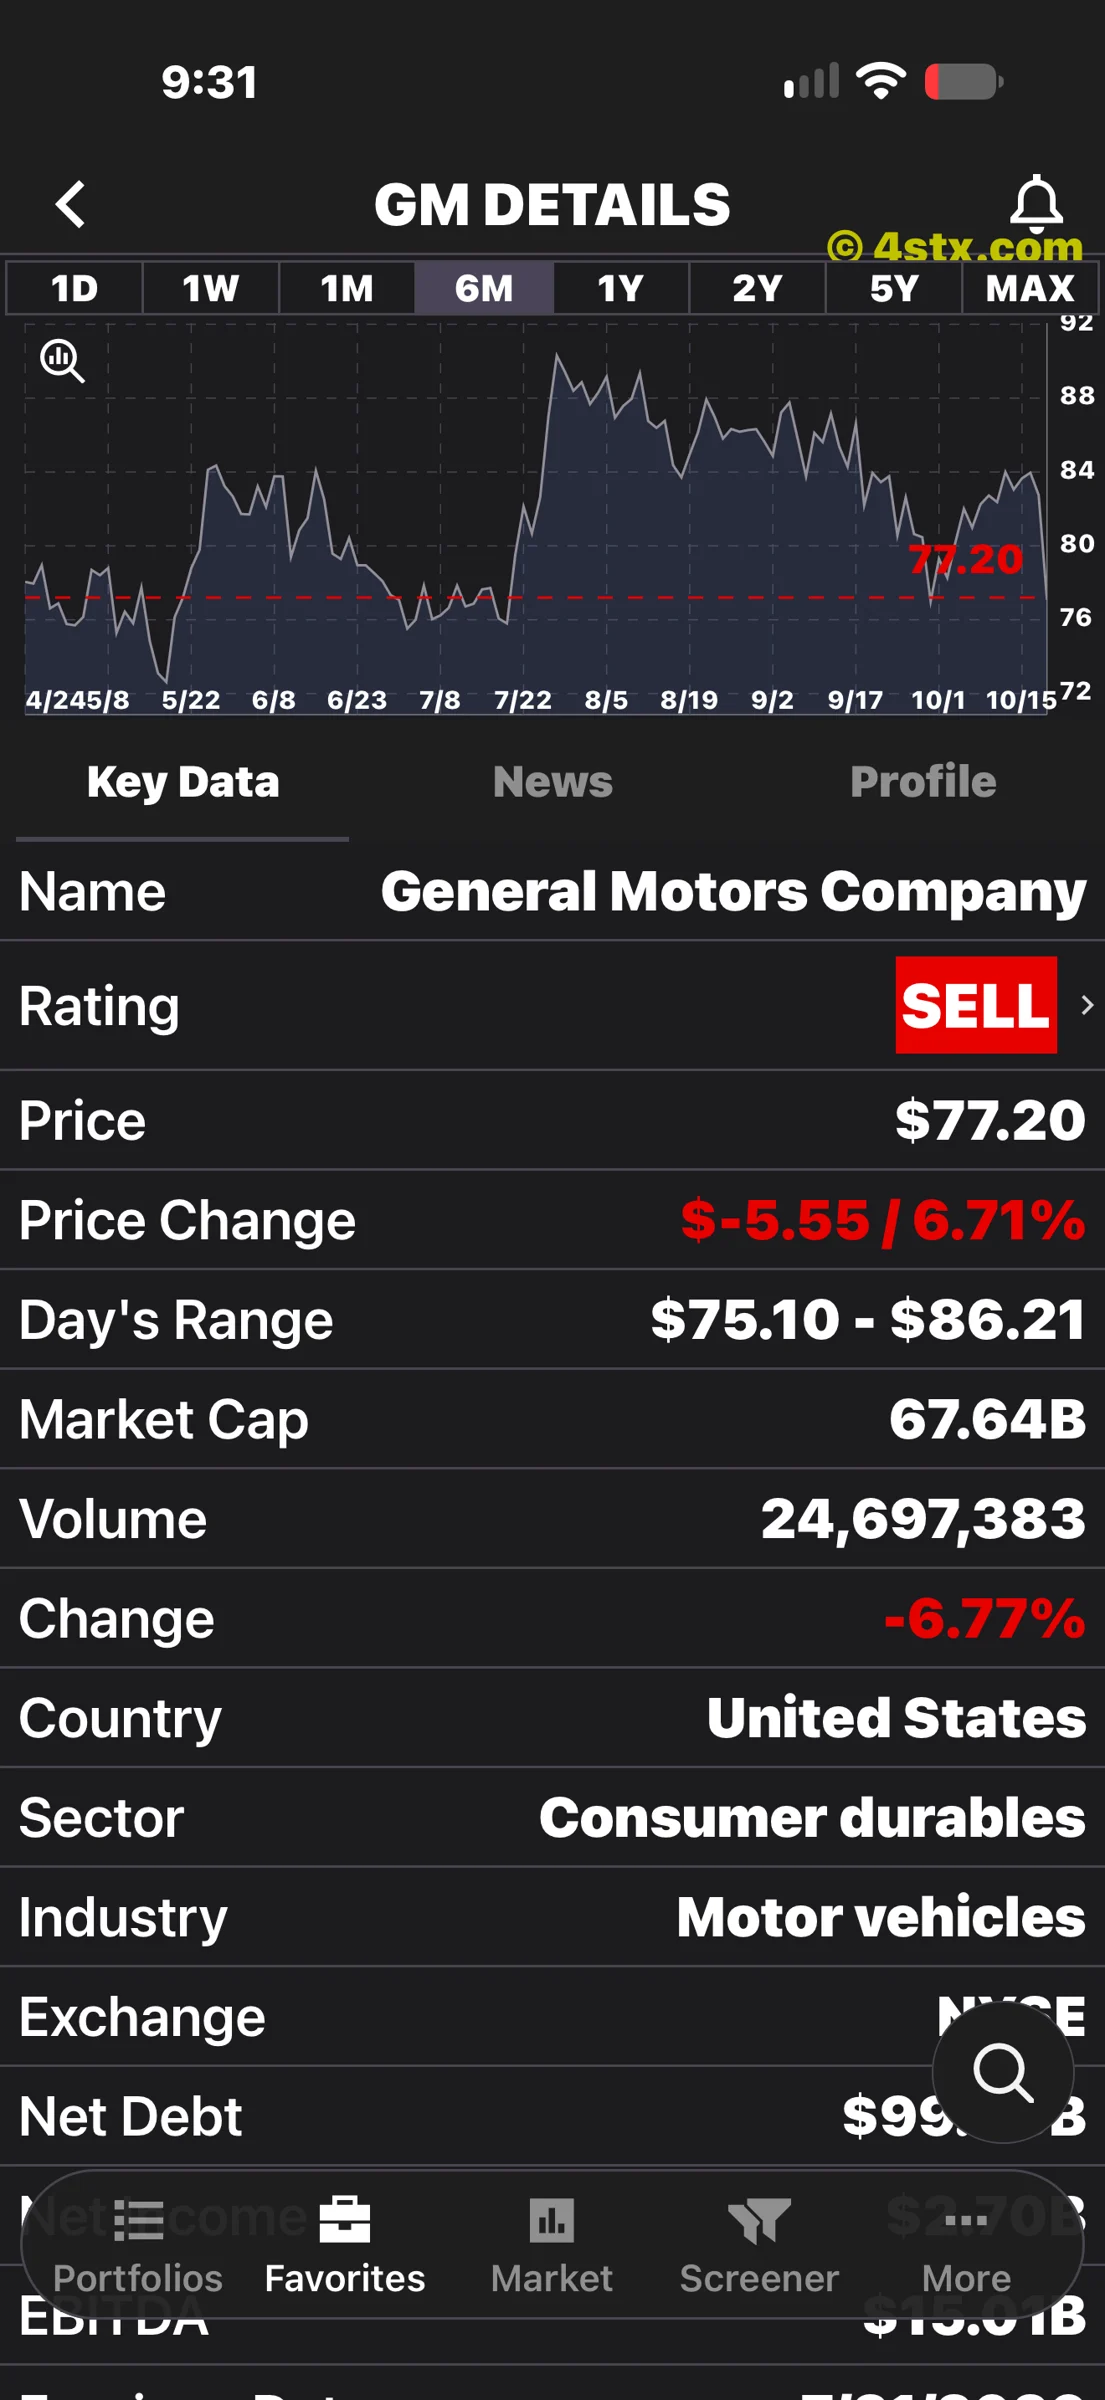
The supplied StockRank cover shows the six-month chart selected and a displayed GM price of $77.20. The company-details screen also shows a SELL label, a $75.10–$86.21 day’s range, a $67.64 billion market capitalization and volume of 24,697,383.
These are captured app figures, not live quotations or verified closing data. The price-change field shows a decline of 6.71%, while a separate change field shows -6.77%. We retain the screens as supplied rather than pretending those fields are identical. They may reflect different calculations or updates; the screenshots alone do not explain the difference.
Financial figures need matching periods
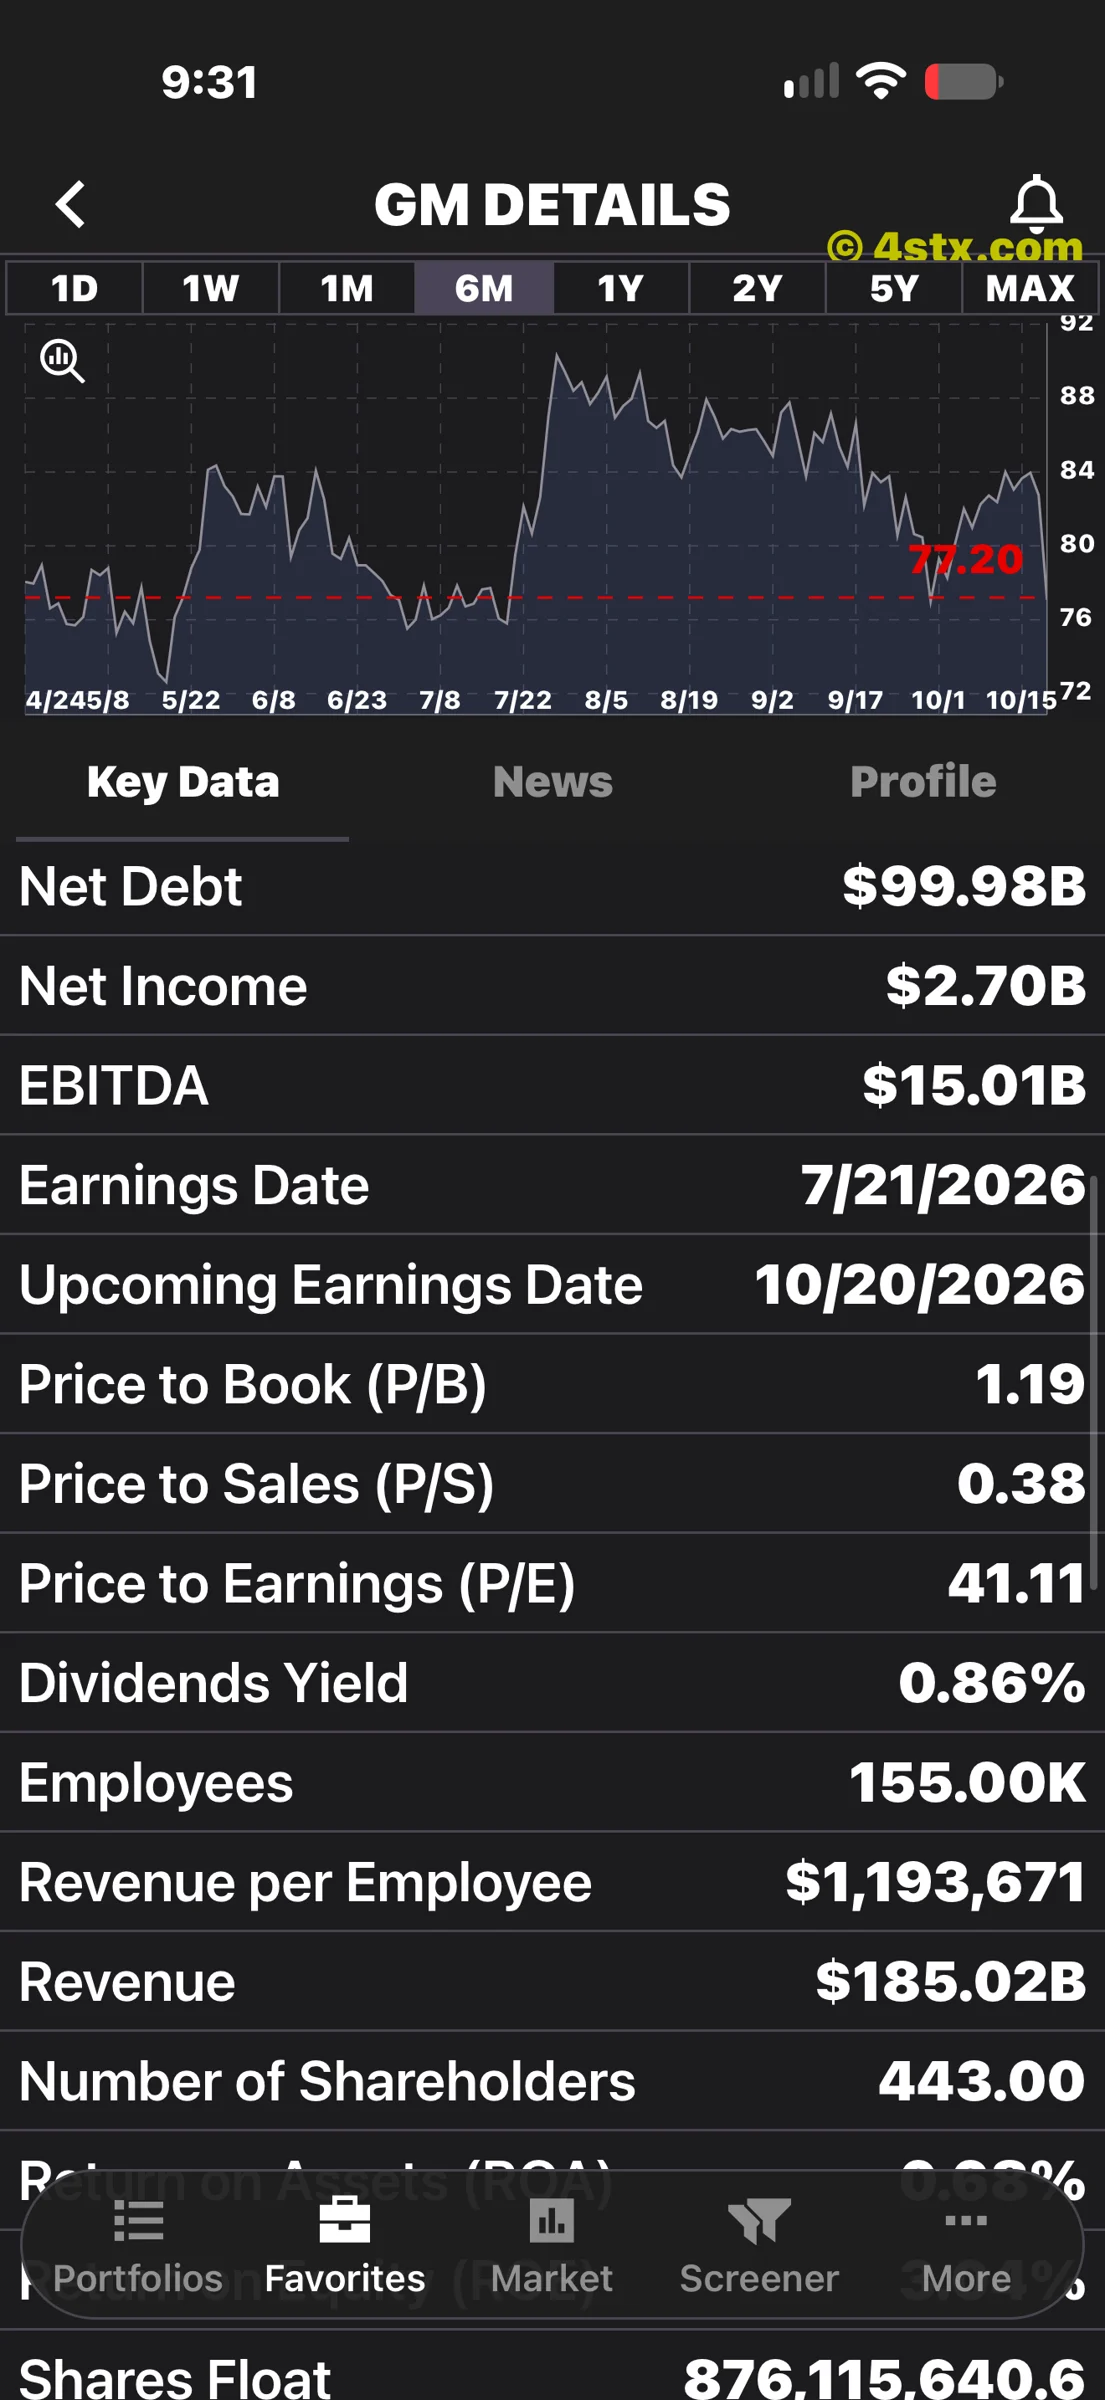
The financial-data screenshot displays net debt of $99.98 billion, net income of $2.70 billion, EBITDA of $15.01 billion and revenue of $185.02 billion. It lists a P/E ratio of 41.11 and dividend yield of 0.86%. These fields are not labeled as the newly released third-quarter results and must not be compared as if they describe the same period.
The app also still labels October 20, 2026 as an upcoming earnings date. GM’s dated release establishes that the results were announced that day. This illustrates why a research screen should be read alongside the underlying company disclosure.
Assets, returns and trading ranges
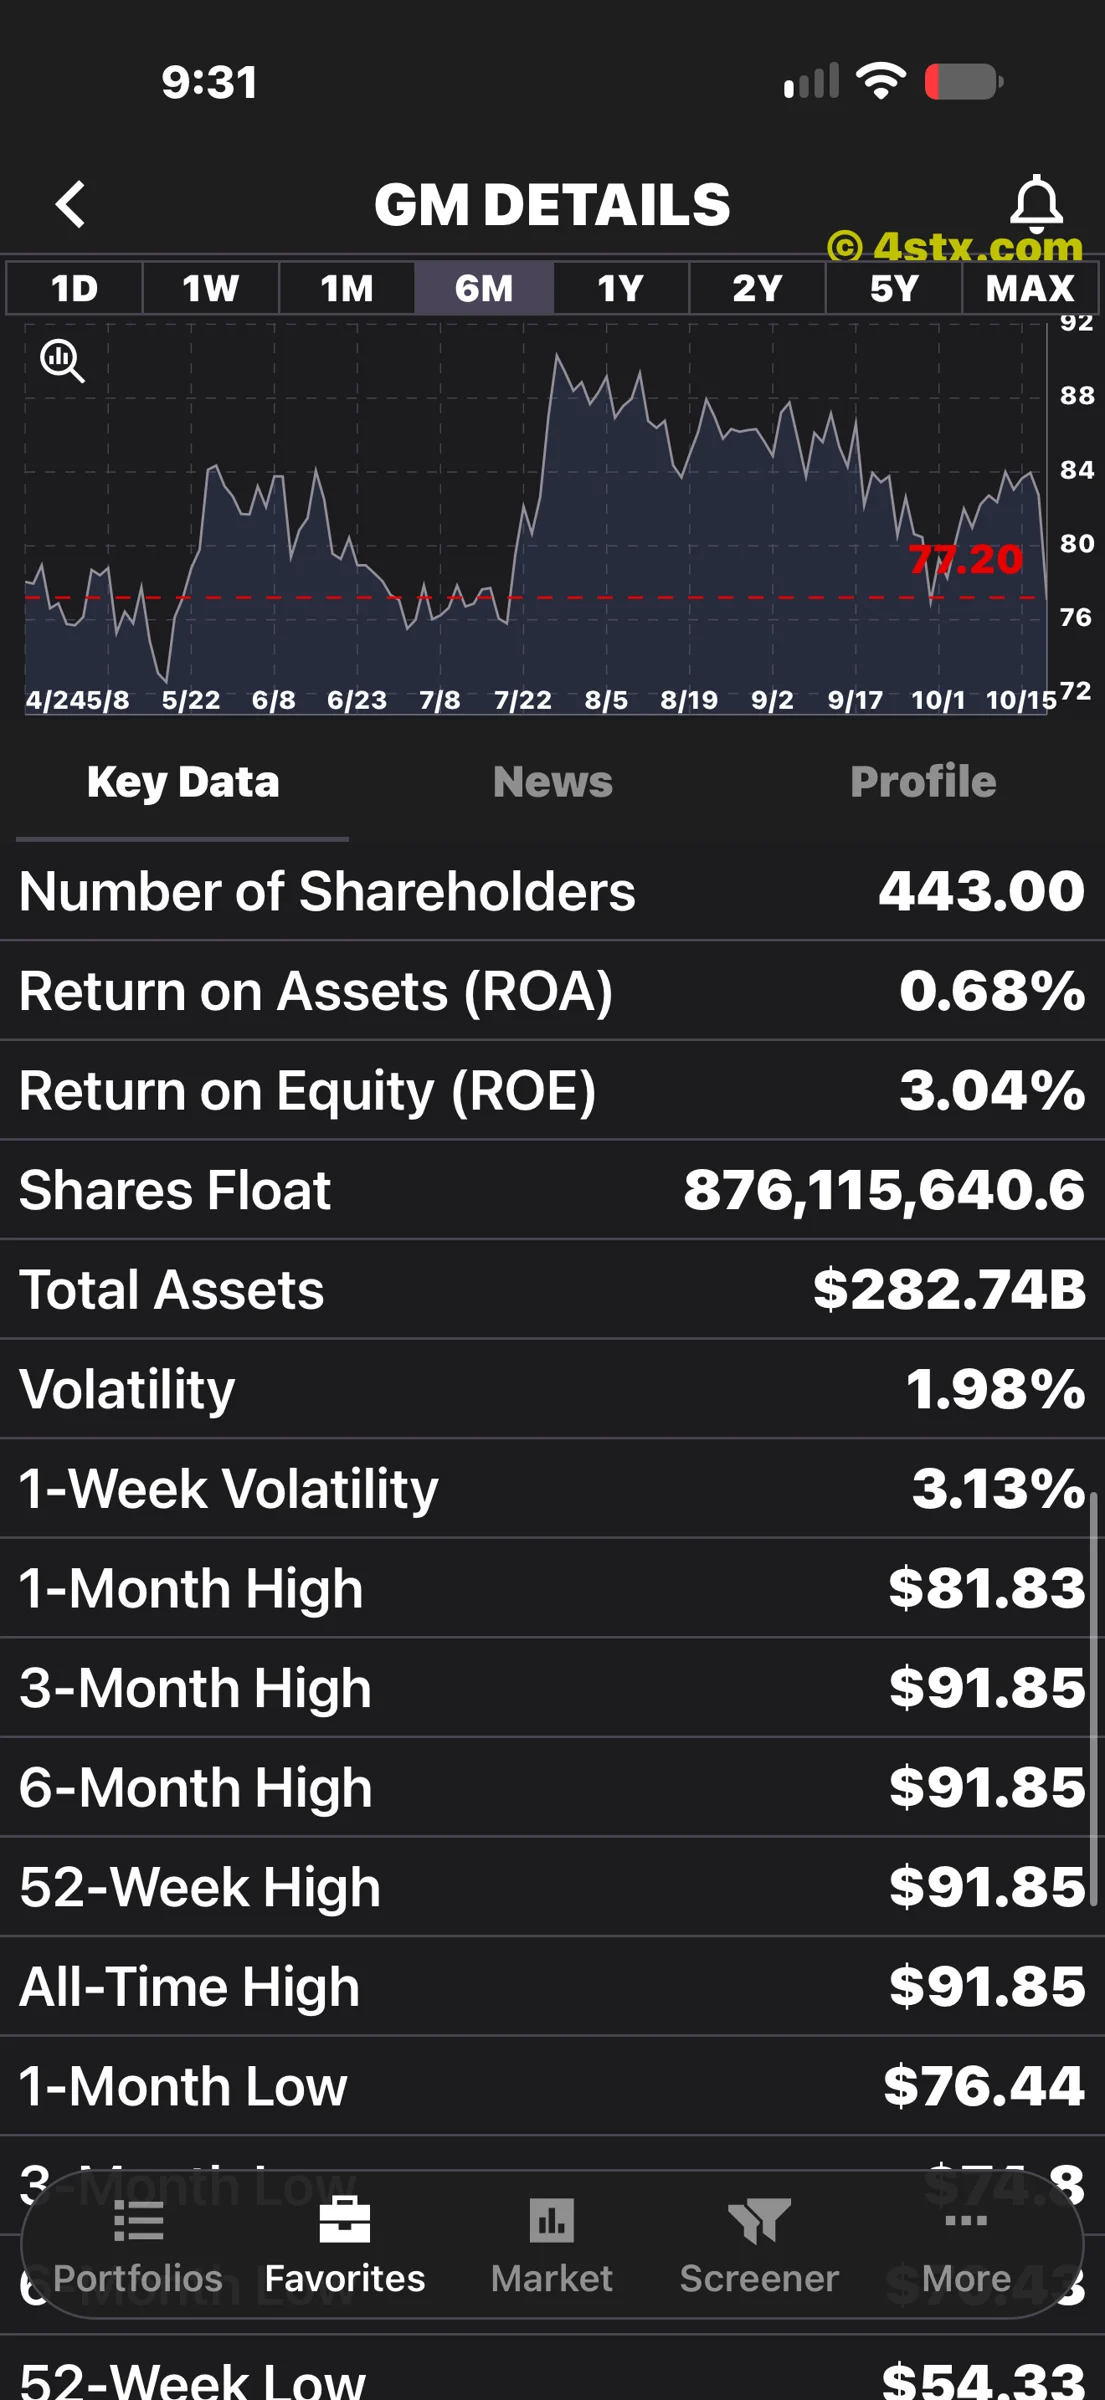
Another screen displays total assets of $282.74 billion, return on assets of 0.68% and return on equity of 3.04%. Its high-price fields show $91.85 for several periods. The next screen lists a six-month low of $70.43 and a 52-week low of $54.33.
These panels help readers locate different categories of information within StockRank. They do not establish that every figure shares one update time or accounting basis. Highs and lows describe ranges; they do not predict where a stock must trade next.
Performance depends on the chosen window
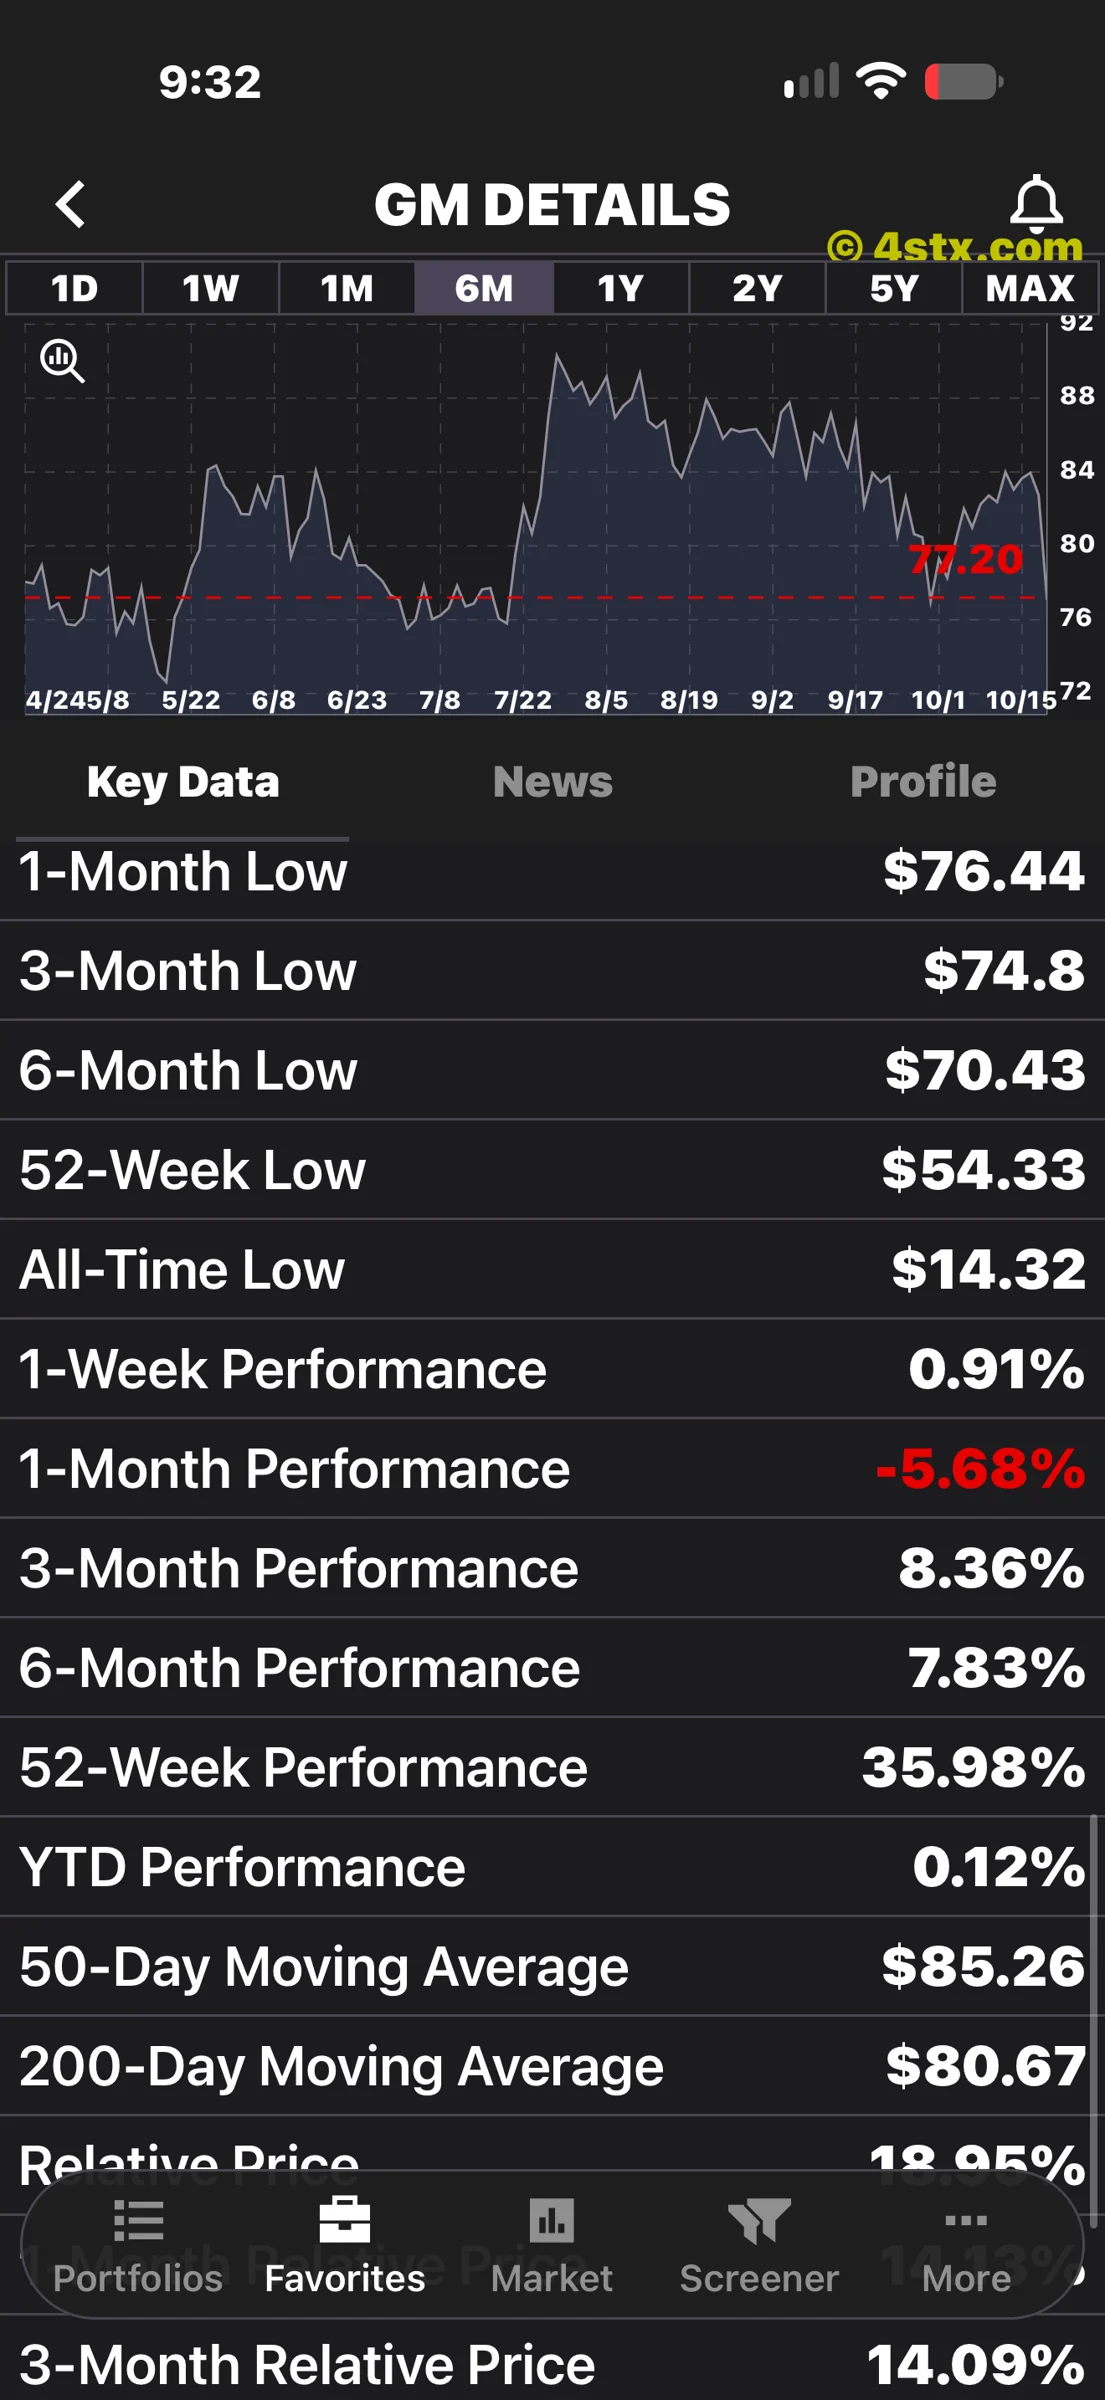
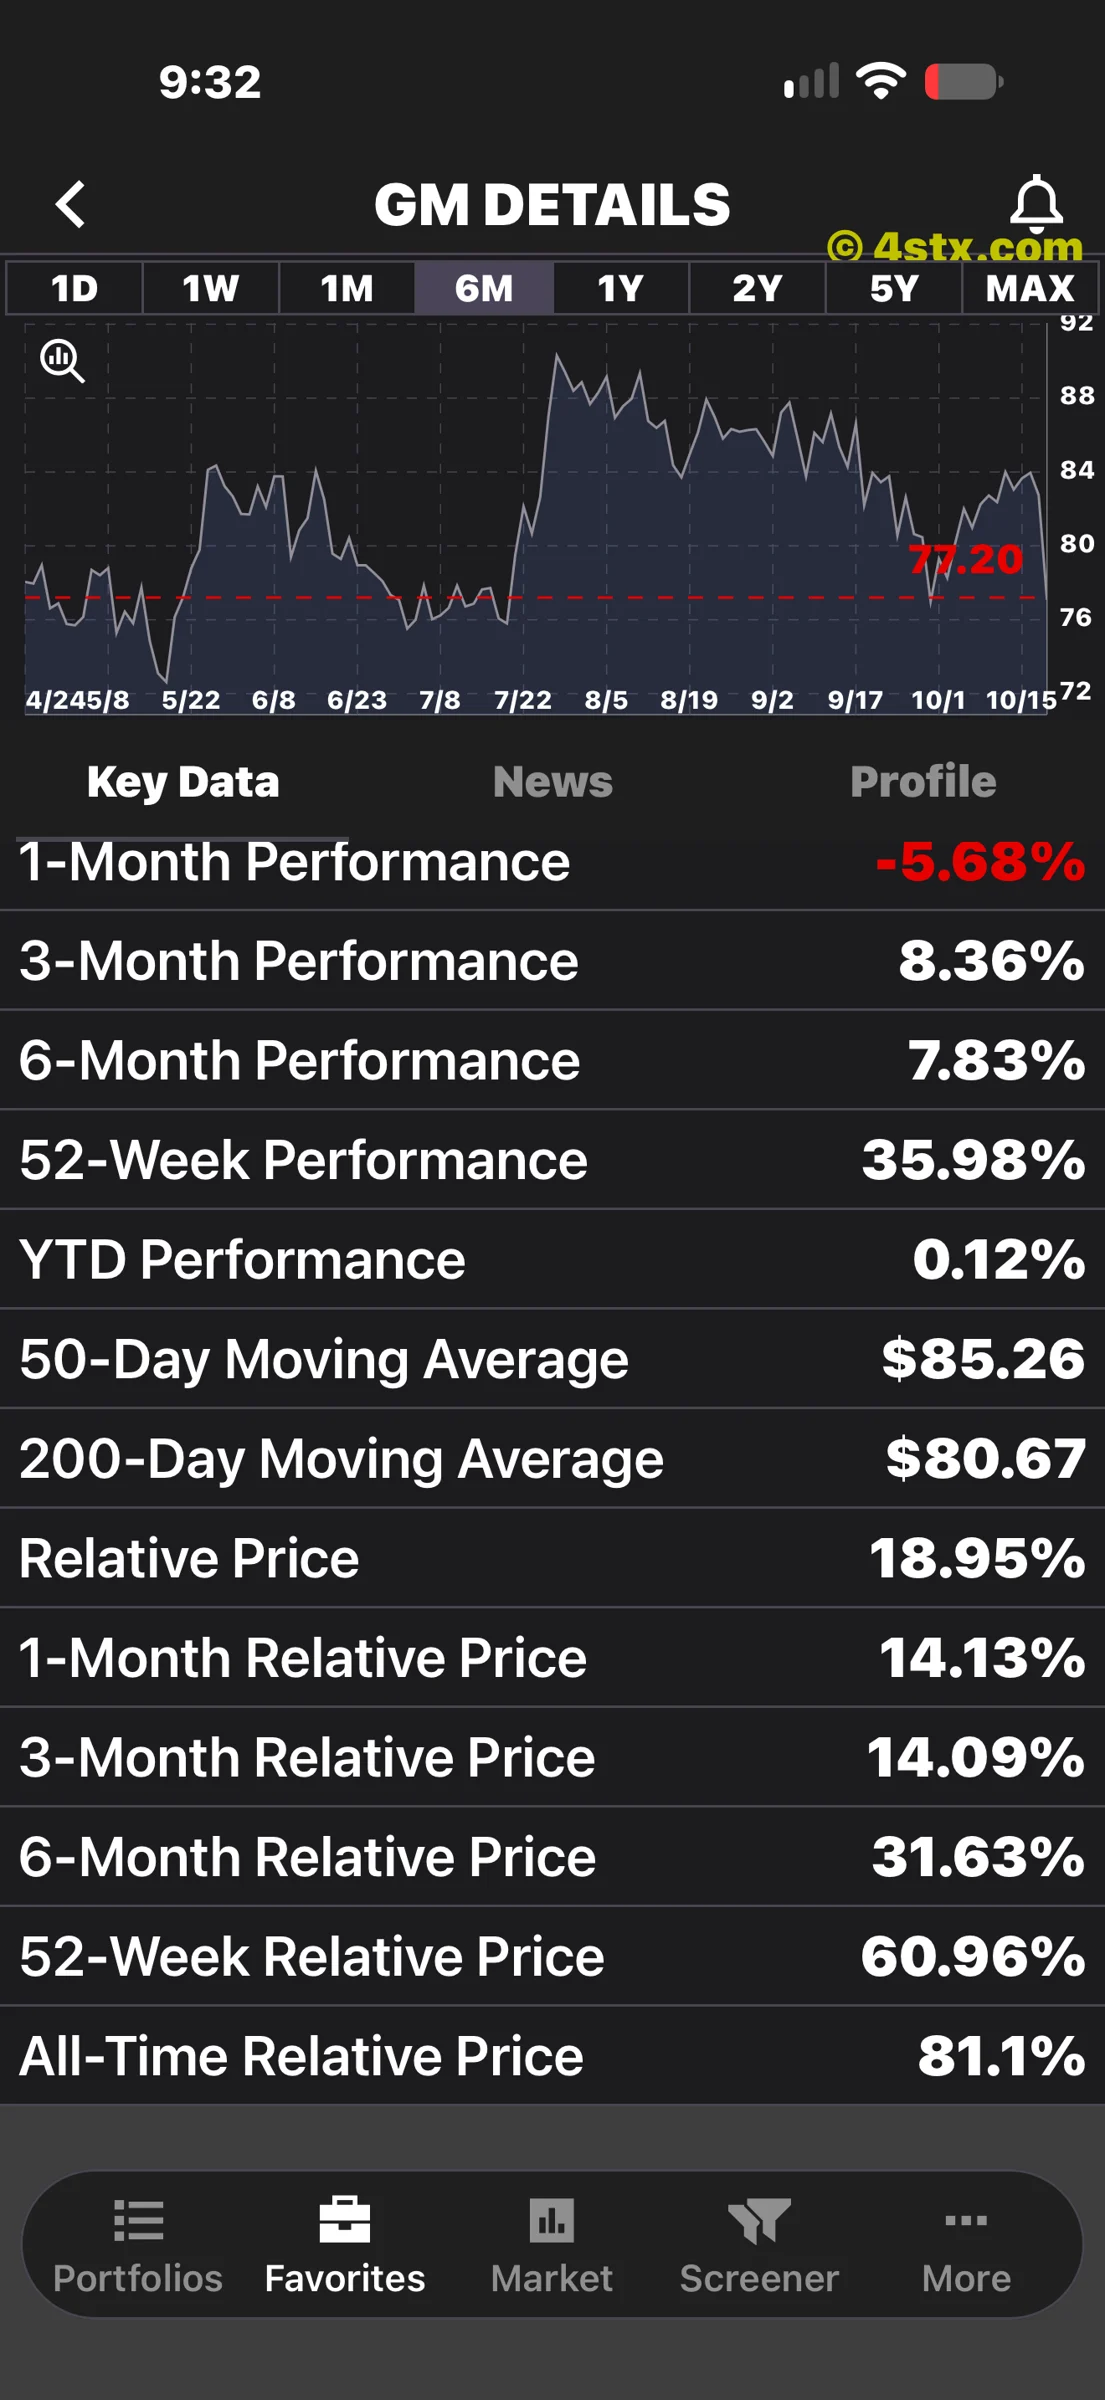
The performance screens display one-month performance of -5.68%, three-month performance of 8.36%, six-month performance of 7.83% and 52-week performance of 35.98%. They also show 50-day and 200-day moving averages of $85.26 and $80.67.
Different windows can tell different stories without being interchangeable. A positive longer-term field does not erase a negative shorter-term field. Nor should a chart’s visible shape be used to infer the cause of a particular price move. The screens are useful research views, not proof that a trading strategy will succeed.
The profile connects GM to its businesses
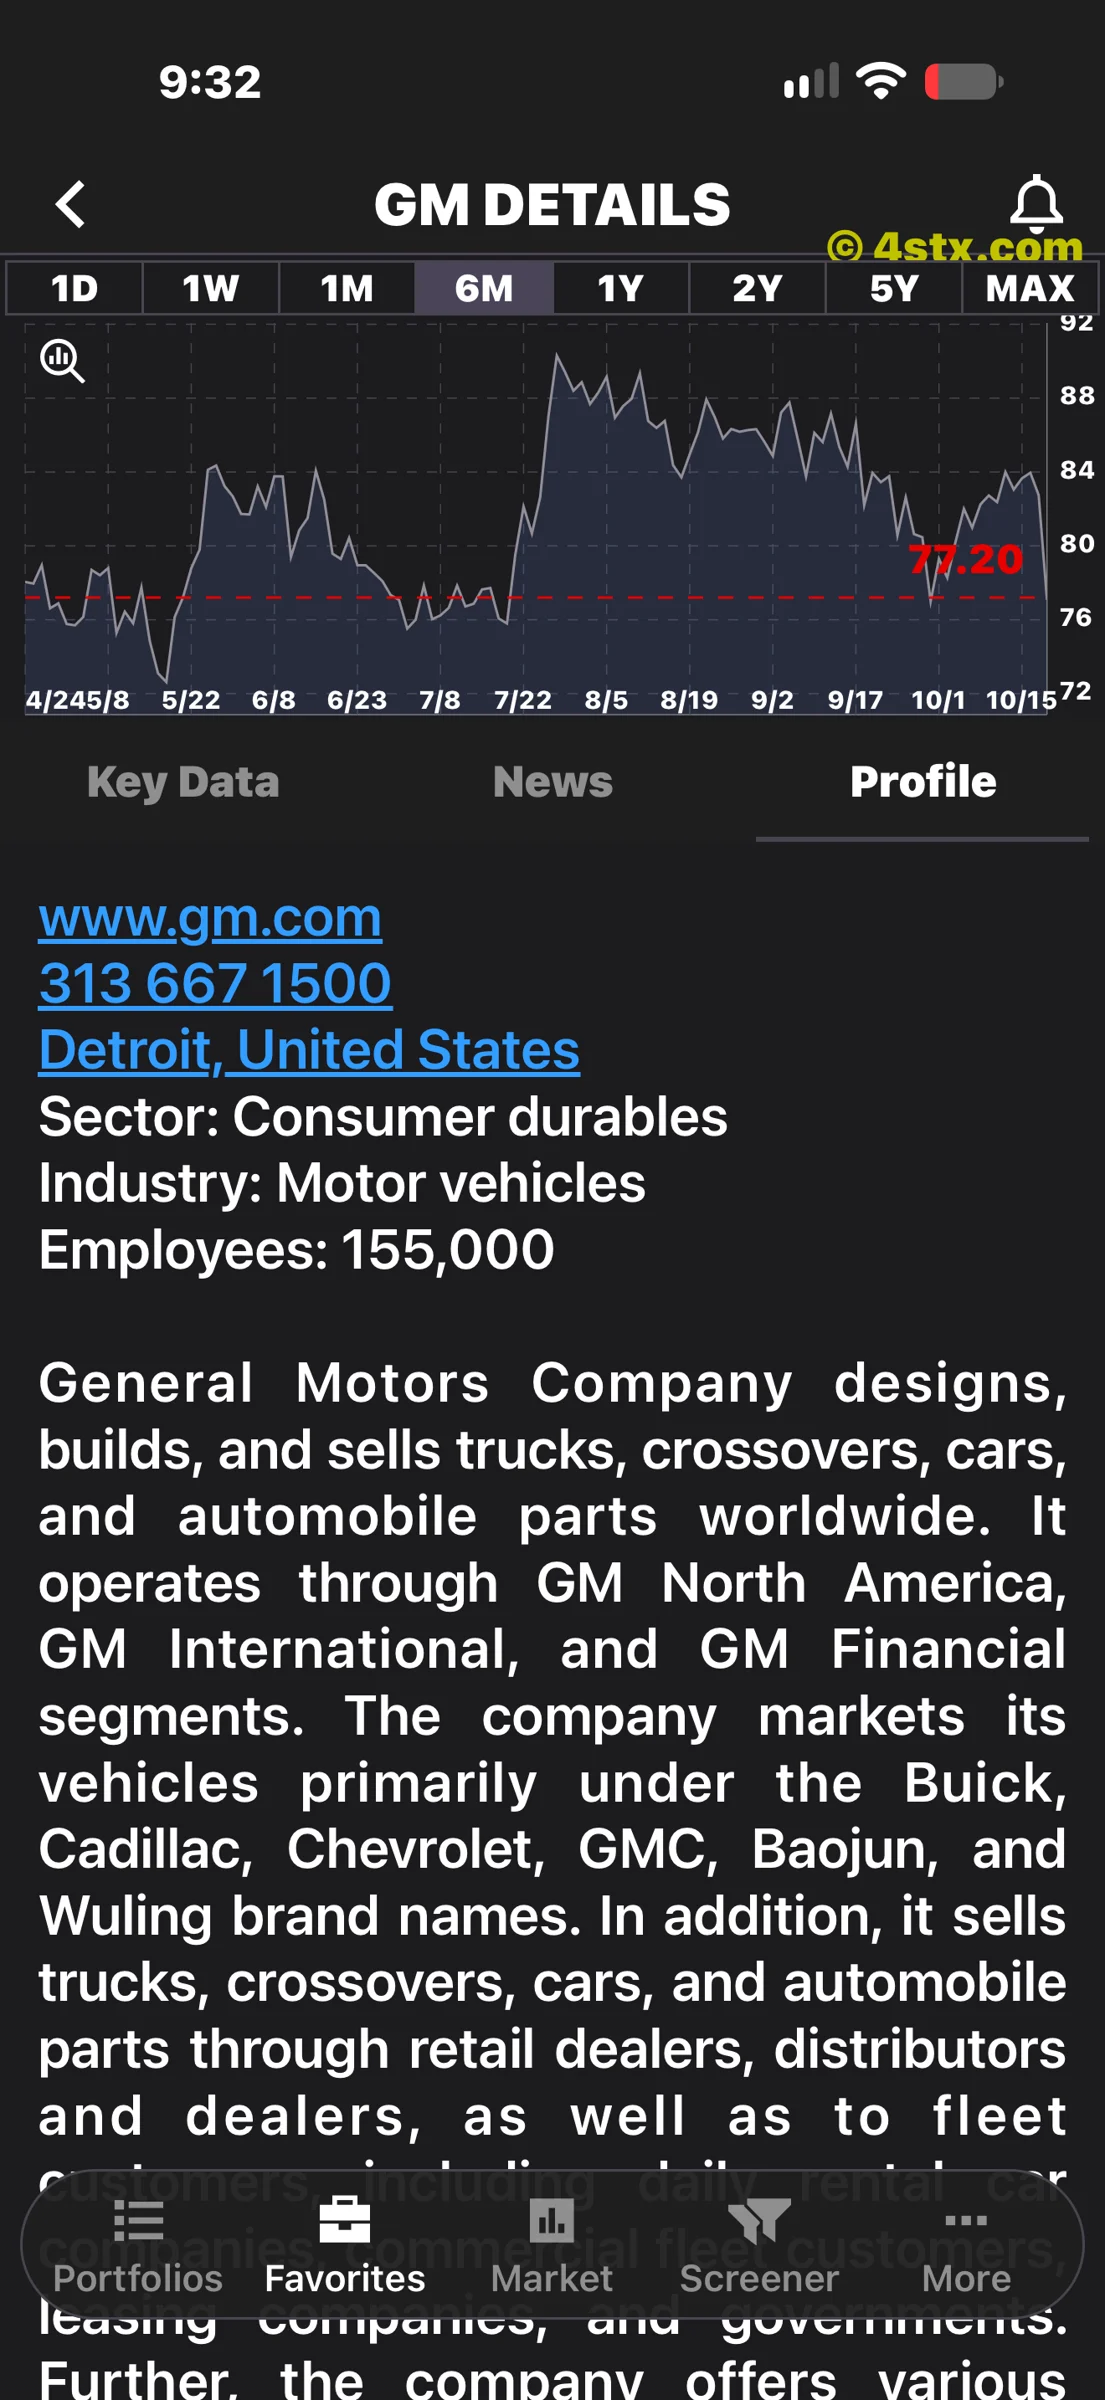
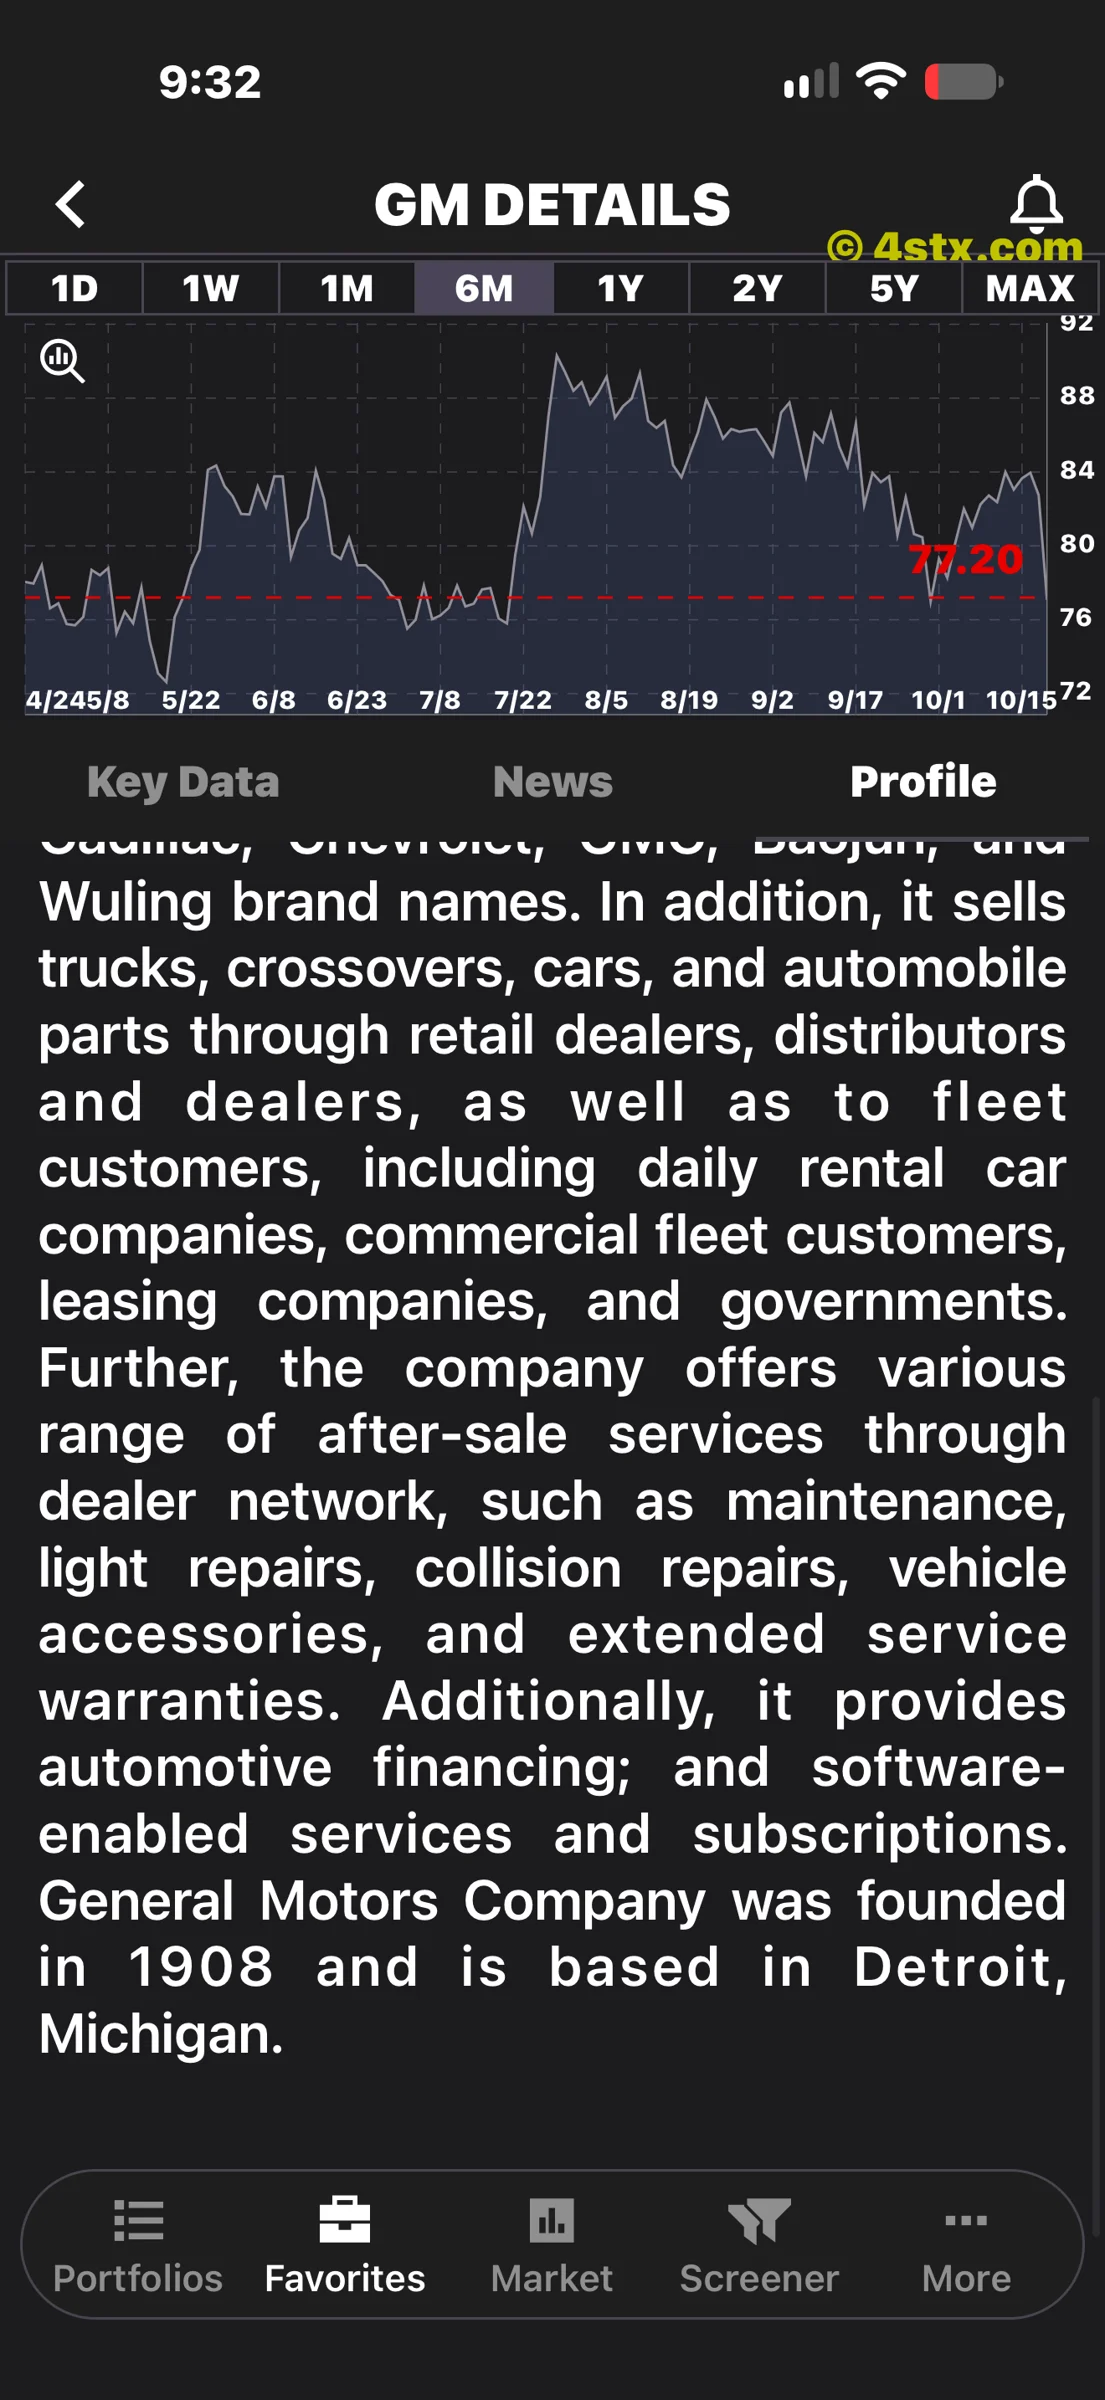
The two profile screenshots describe vehicle manufacturing, brands, dealer and fleet distribution, after-sales services, automotive financing and software-enabled services. They also show Detroit, a company website and a workforce figure of 155,000 as displayed in the app.
That breadth matters when reading an automaker’s financial screen. A reader should understand what the business includes before interpreting a consolidated balance-sheet number. The profile provides an introduction; the latest filings provide the dated accounting detail.
News and rating history are research tools
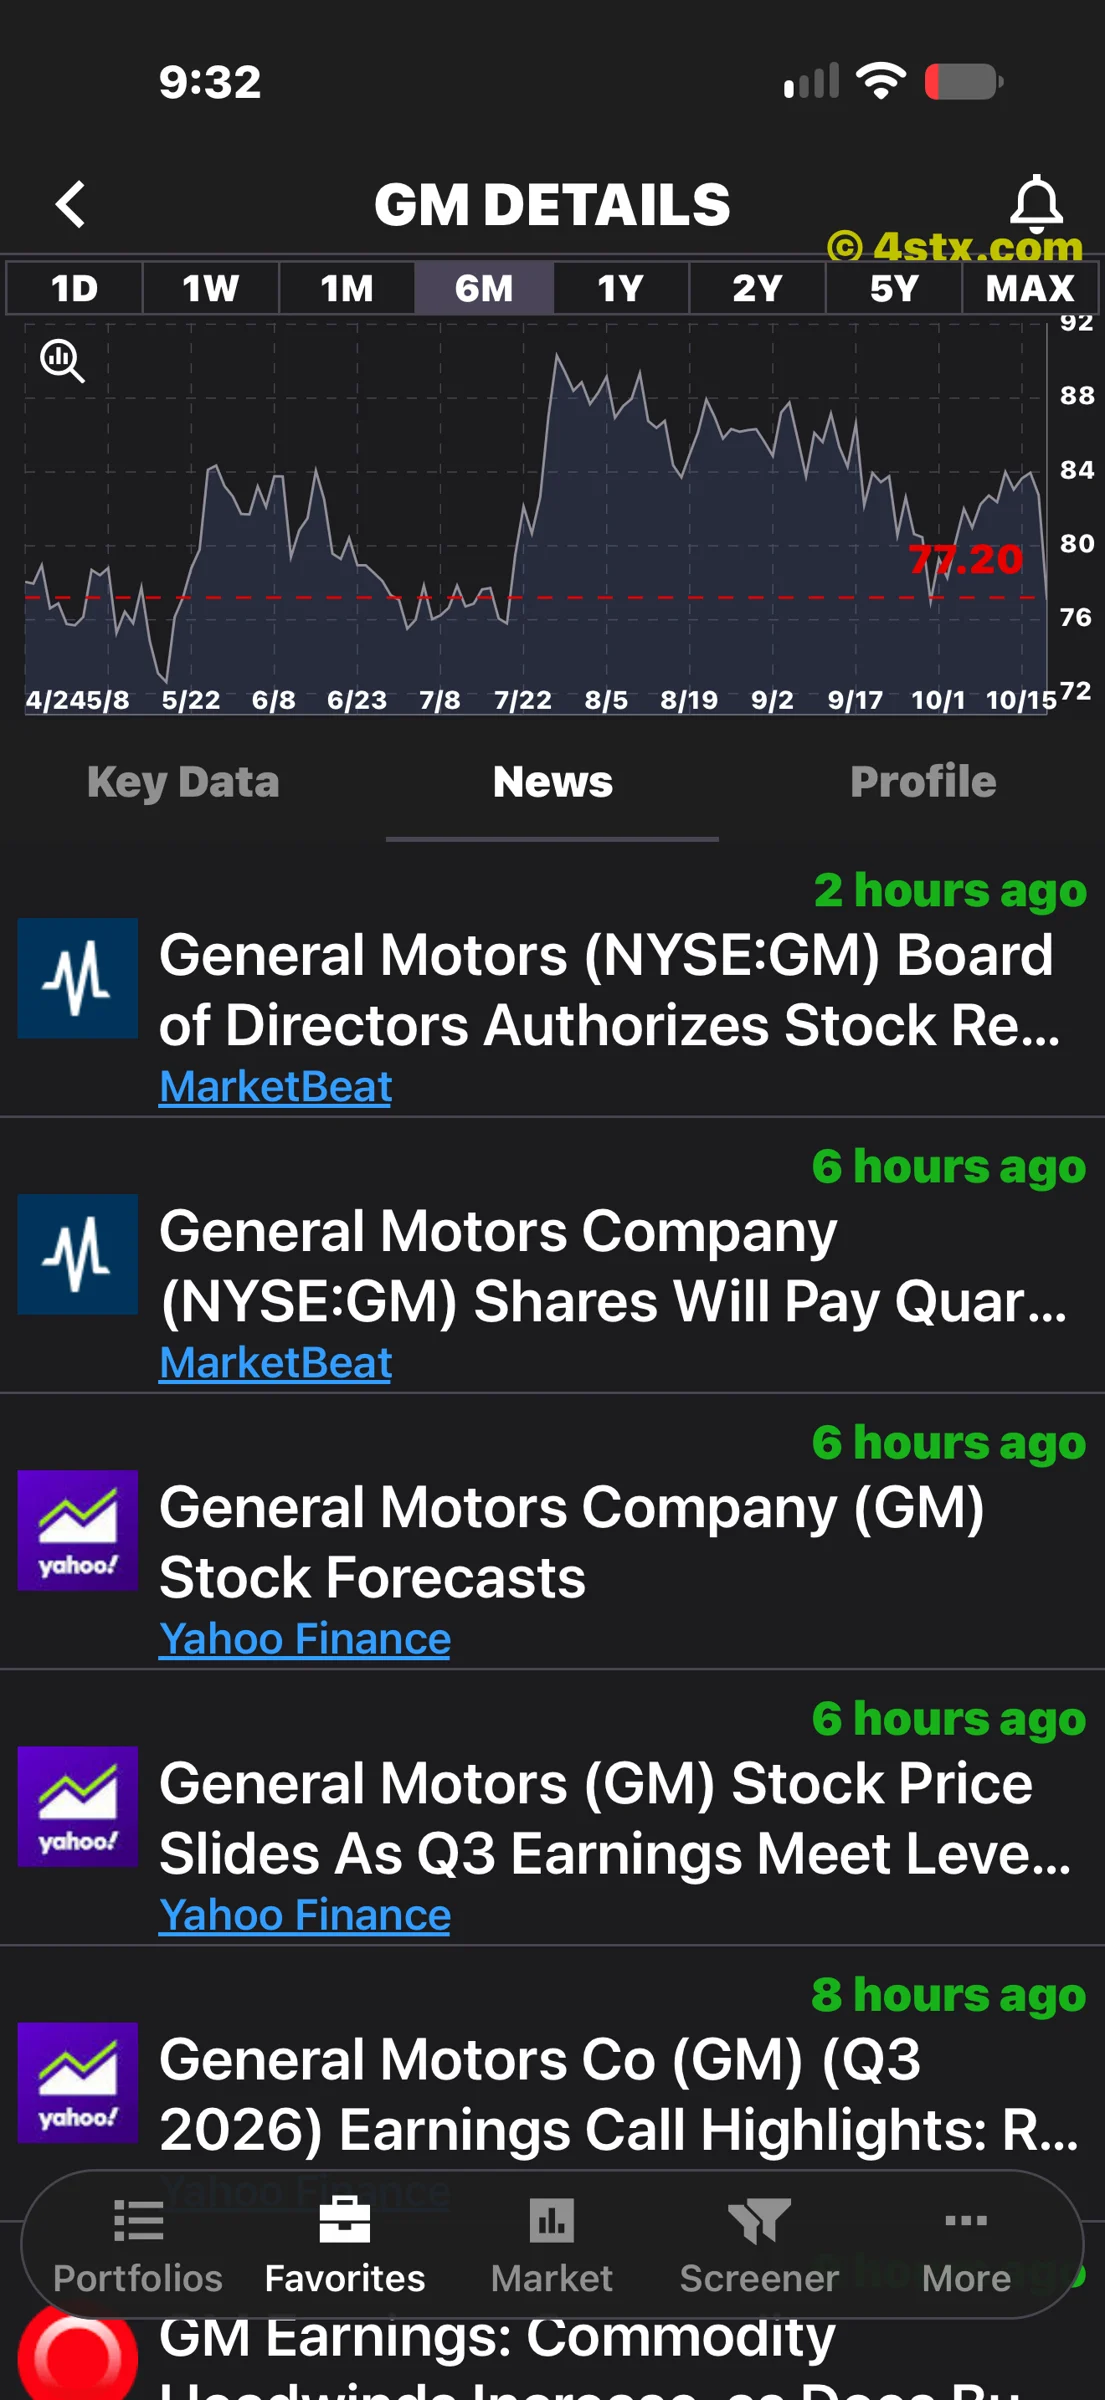
The news screen links to headlines concerning repurchases, dividends, forecasts and earnings. Relative timestamps such as “2 hours ago” belong to the captured interface. A headline is an invitation to read the original reporting, not independent verification of every claim.
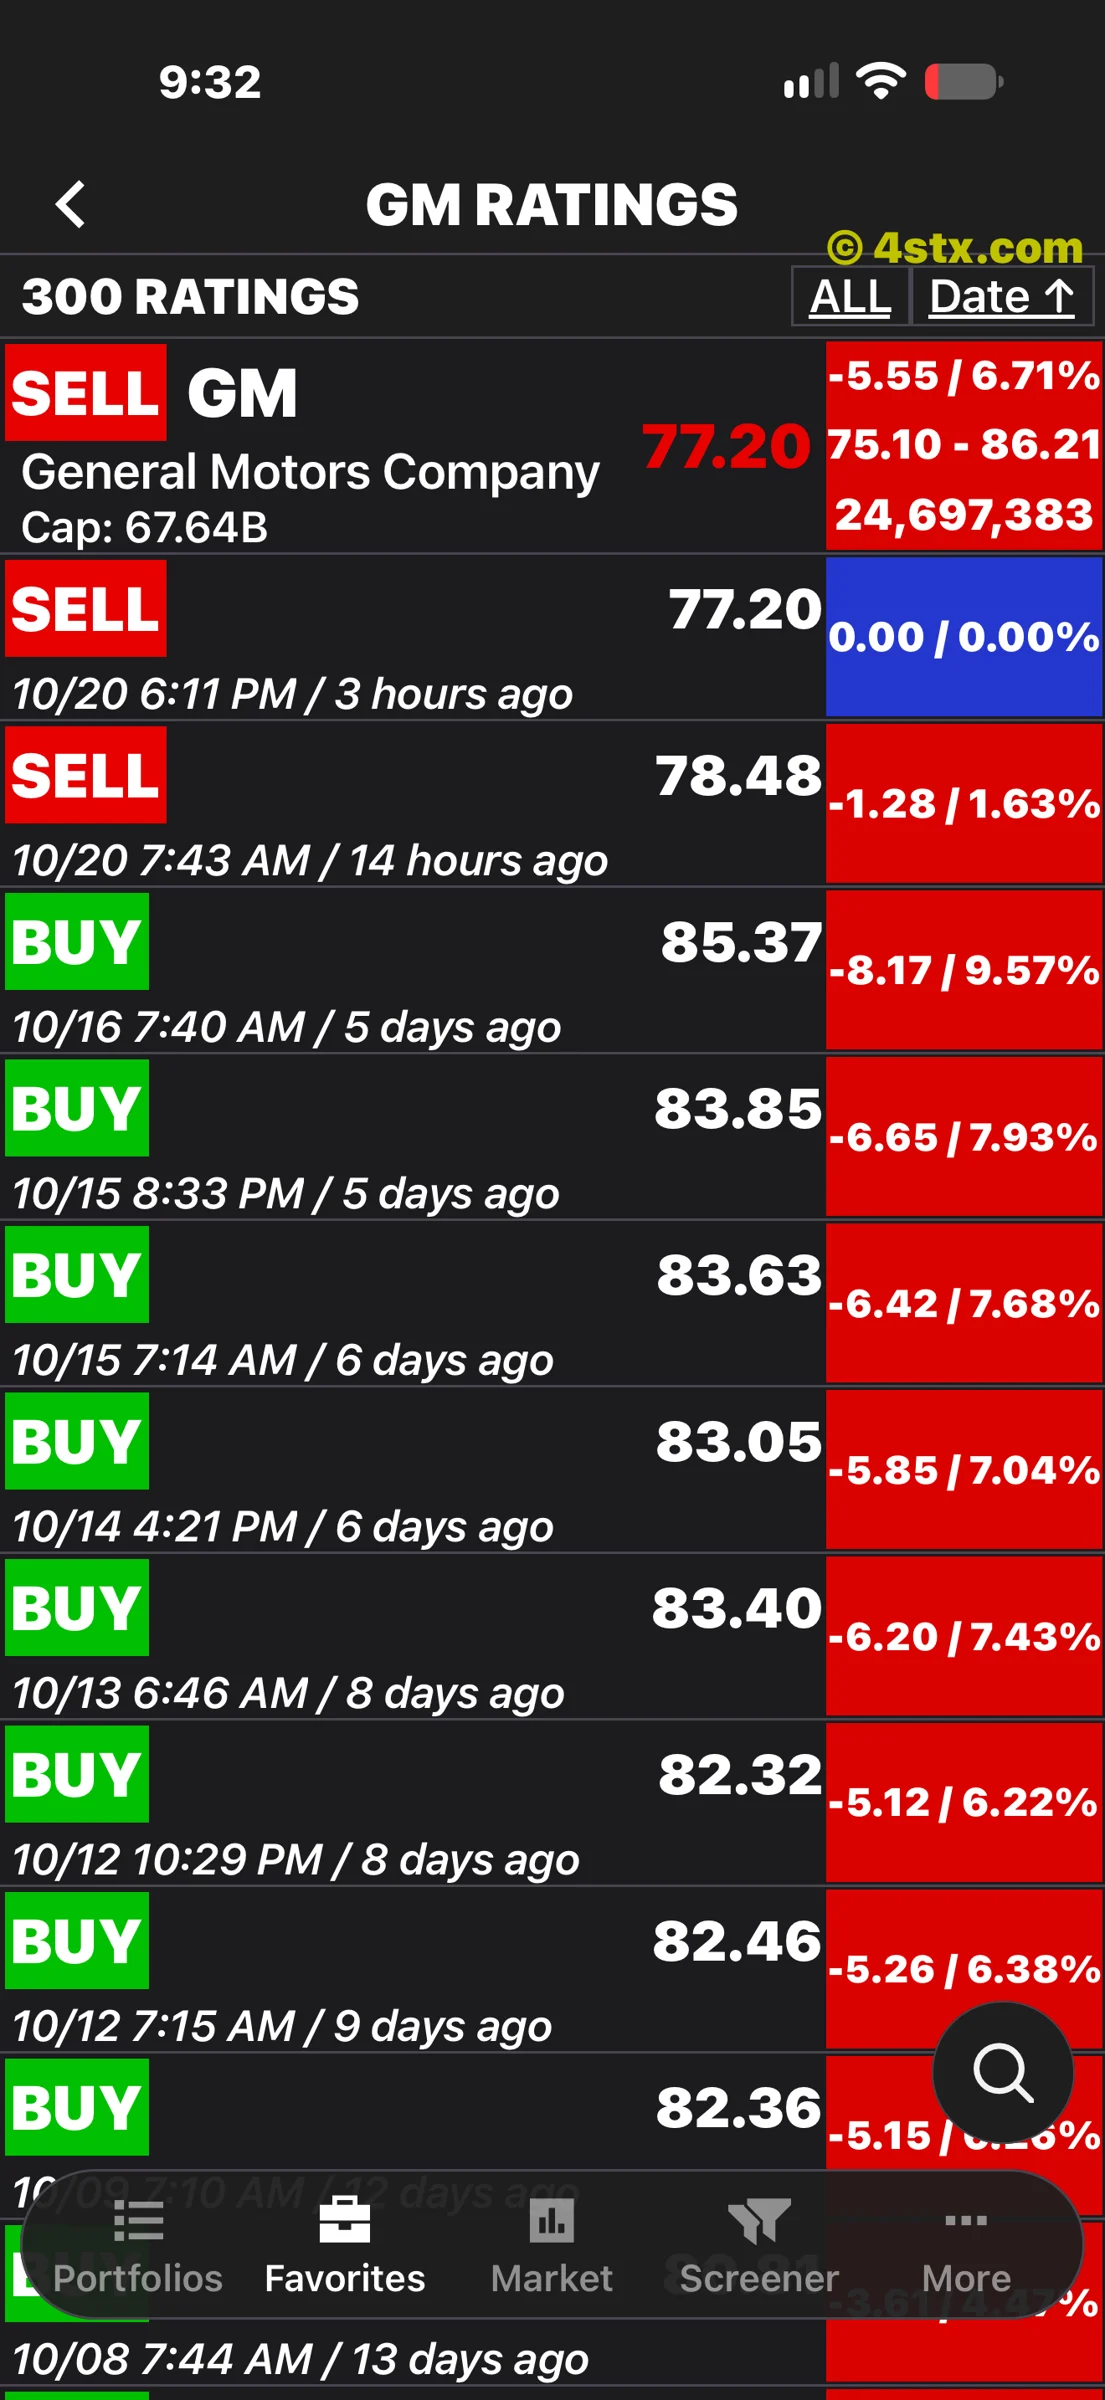
The ratings screen shows SELL entries dated October 20 and earlier BUY entries. These are the app’s labels and historical display, not this article’s recommendations. The visible price differences should not be described as an audited trading record or a guaranteed result.
Explore GM in the StockRank App
All ten images are authorized StockRank App screenshots: one cover and nine supporting research views. Use the chart, details, profile, news and rating history to connect a ticker with the underlying company. Verified Apple App Store and Google Play download links are included below.
For GM, the central follow-up remains practical: distinguish an authorized repurchase from completed purchases, and examine whether operating performance supports the company’s capital-allocation choices.