The snack aisle has become a useful place to watch the negotiation between companies and household budgets. A bag that once felt like an automatic addition to the cart now invites a second look. PepsiCo’s latest pricing plans give shoppers another reason to make that comparison carefully.
Associated Press reported on October 8, 2026 that PepsiCo plans single-digit percentage increases on selected products, including Doritos, Ruffles, SunChips and some sodas. The company cited higher fuel, aluminum and agricultural commodity costs. AP also reported that prices would remain below their levels at the beginning of the year.
An increase can follow a cut without erasing it
Earlier in 2026, PepsiCo announced lower prices for selected snack products. Its February announcement described lower prices with unchanged package sizes for products including Lay’s, Doritos and Cheetos.
That creates two comparisons for shoppers: the price against its recent discounted level, and the price against the earlier level. Both can be accurate while telling different stories.
Consider a purely hypothetical bag originally priced at $5. A 10% reduction takes it to $4.50. A subsequent 5% increase takes that reduced price to $4.725, or approximately $4.73. It is more expensive than the discounted bag, but still cheaper than the original one.
Those percentages are illustrative, not PepsiCo’s announced product-level changes. The example explains why a company can describe prices as remaining lower while a shopper notices a new increase.
The earnings report describes a different shopping basket
PepsiCo’s October 8 earnings release, filed with the Securities and Exchange Commission, reported quarterly net revenue of $25.274 billion, up 5.6%. Organic revenue rose 3.1%; that is a company-defined non-GAAP measure.
Those results cover a global business. They do not measure the price of one bag in one supermarket. The company’s North American food business had flat reported revenue and flat volume in the quarter, while North American beverage volume fell 2%.
The distinction matters because a company’s sales growth can coexist with a difficult market for particular products. Readers should resist translating an overall revenue percentage into an assumed increase on every shelf label.
For a household, the useful basket is its own. A shopper buying soda every week and chips occasionally will experience a different change from someone with the opposite pattern. An earnings report helps explain the business; receipts explain the personal bill.
Compare the contents as well as the checkout price
A practical comparison begins with the exact product and package. Different sizes, multipacks and promotions can make an apparently smaller price look more attractive than it is.
Imagine two hypothetical bags of similar snacks: a 10-ounce bag for $4 and an 8-ounce bag for $3.60. The first costs 40 cents per ounce; the second costs 45 cents. The lower checkout total buys less food at a higher unit cost.
That does not automatically make the larger bag the better purchase. A shopper who only wants eight ounces may reasonably prefer the smaller cash outlay. The calculation simply makes the trade-off visible.
No actual retailer prices or package changes have been verified for this article. These examples are original arithmetic intended to clarify how to compare offers, not claims about a particular store.
Small purchases deserve a weekly frame
A single snack purchase rarely looks like a major financial decision. Repetition changes the perspective.
In another hypothetical example, adding 25 cents to a purchase made four times a week adds $1 to weekly spending. Over 52 weeks that is $52, assuming the same buying pattern continues. It is neither a fortune nor nothing.
The value of that calculation is proportionality. It avoids turning a modest increase into a financial catastrophe while still recognizing that frequent purchases accumulate. A household can decide whether convenience, familiarity or an alternative product matters more after seeing the actual difference.
Watch the shelf before declaring the final cost
The announced plans are a reason to pay attention, not a complete list of new retail prices. This article does not establish a uniform increase date, a nationwide price for any bag, or a guaranteed outcome at a particular retailer.
The next useful evidence will be the product, package size and price actually offered where readers shop. Comparing those details with a recent receipt turns a broad corporate announcement into a meaningful household number.
For TasteOfMoney, that is the interesting part of this story: an ordinary pleasure becoming a more deliberate purchase. The decision does not require abandoning the snack aisle. It requires knowing what the money buys.
StockRank charts and app downloads
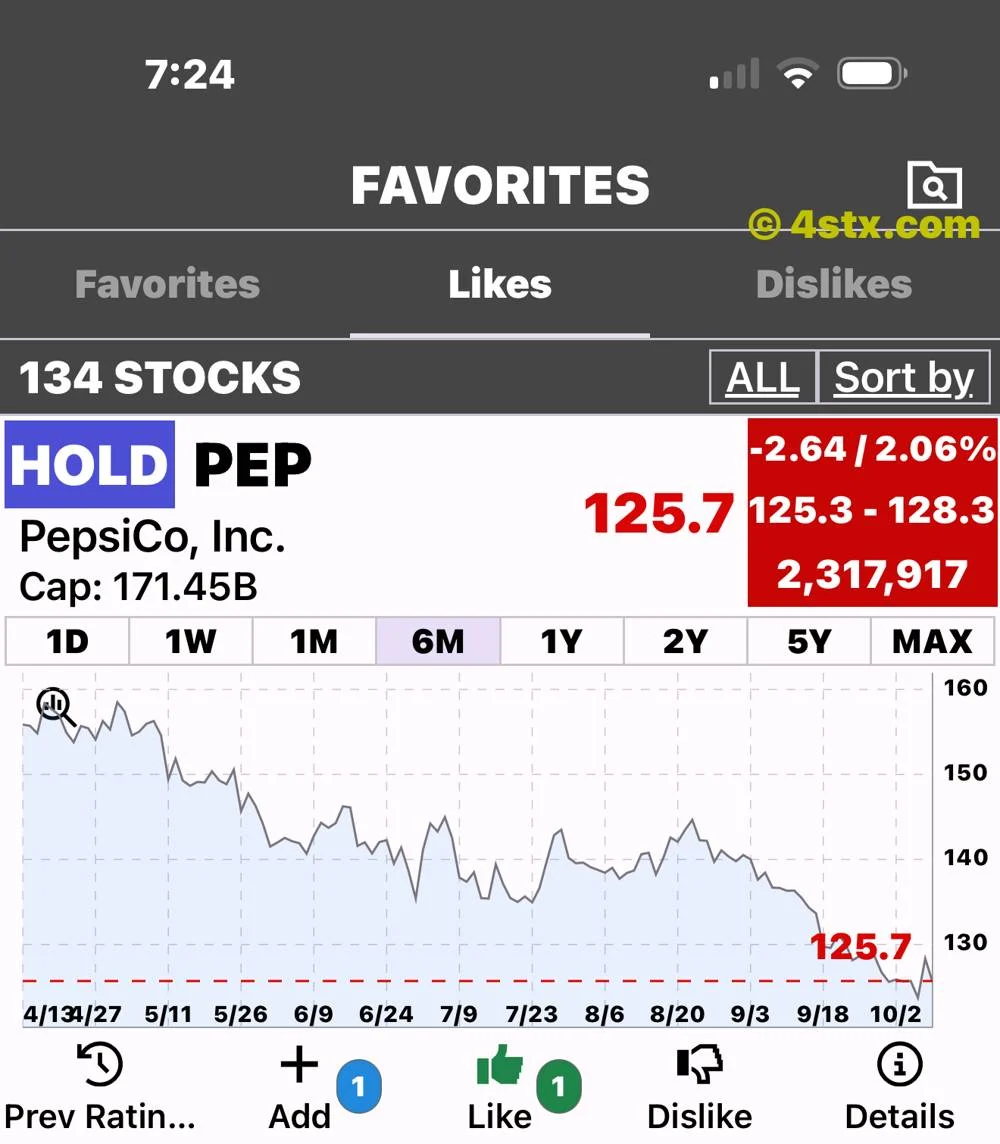
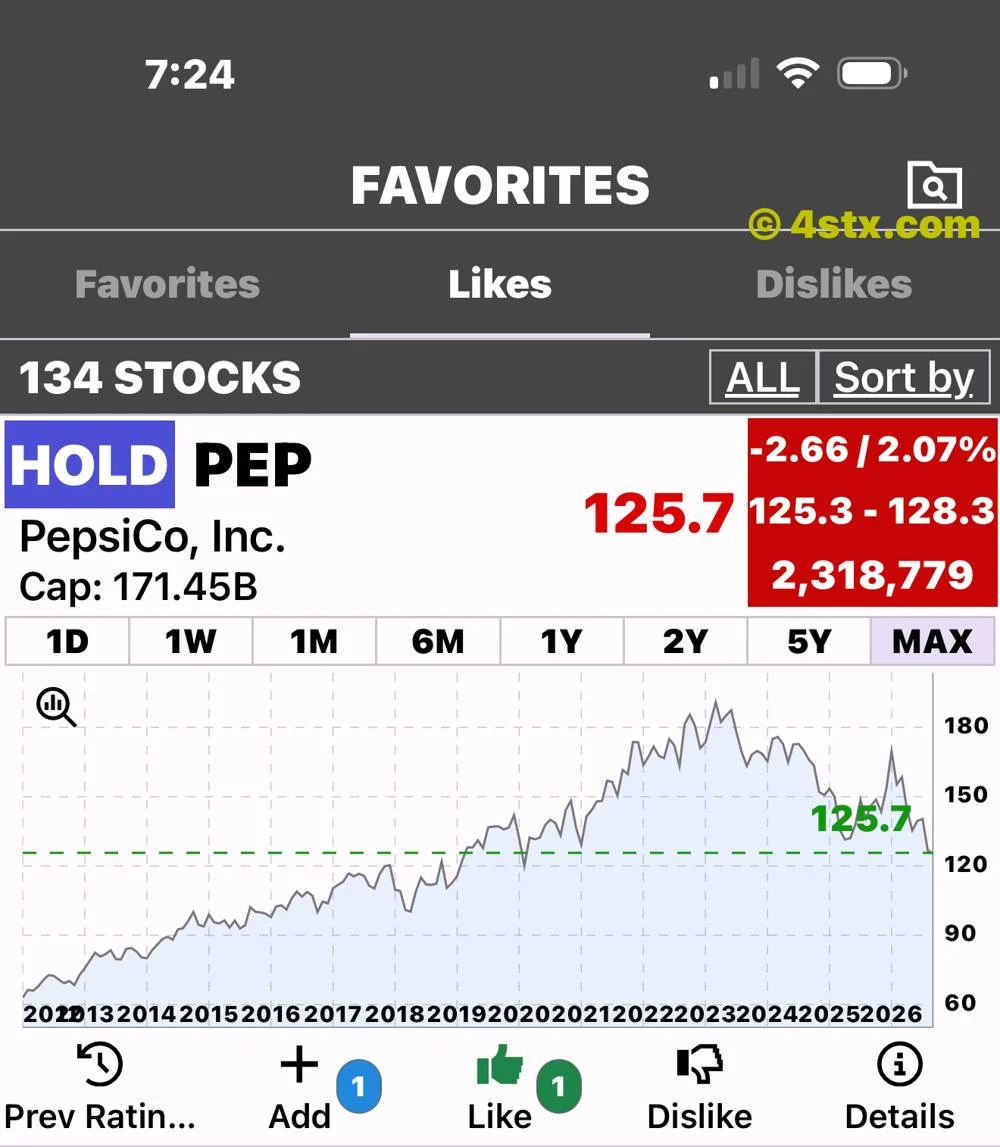
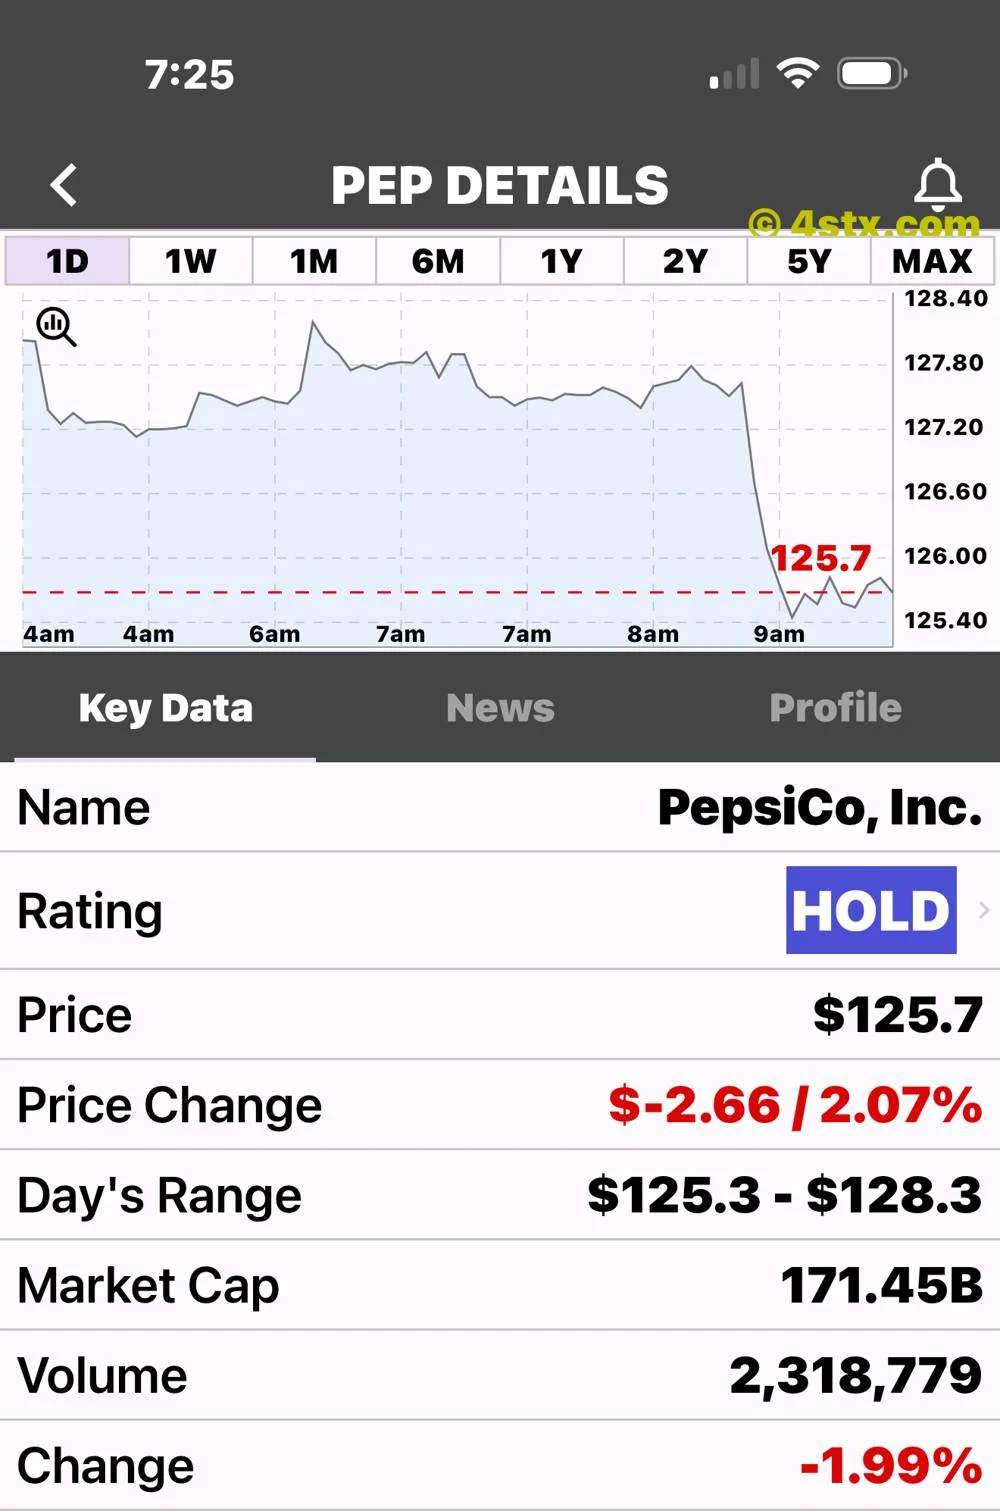
The screenshots in this article were supplied by the user from the StockRank mobile app and carry the visible 4stx.com watermark. The main image shows PEP’s six-month chart; the additional screenshots show its longer-term history and intraday details. Their quotes are screen snapshots, not independently verified closing prices. The charts do not establish that the pricing announcement caused every movement shown. The HOLD label is StockRank’s assessment, not an investment recommendation from this article.
StockRank is available for iPhone through the Apple App Store and for Android through Google Play. Direct download links appear below in Sources & further reading.