Procter & Gamble’s next earnings discussion is scheduled for October 22, 2026, at 8:30 a.m. Eastern Time. Ahead of that event, six user-supplied StockRank screenshots offer a useful tour of PG: its chart, company details, valuation, profitability, performance and business profile.
P&G trades on the New York Stock Exchange under ticker PG. Its connection to household spending is direct: its brands include Tide, Pampers, Gillette and Olay. The coming report provides an opportunity to examine the business behind purchases that recur in ordinary budgets.
The six-month chart shows a late upswing
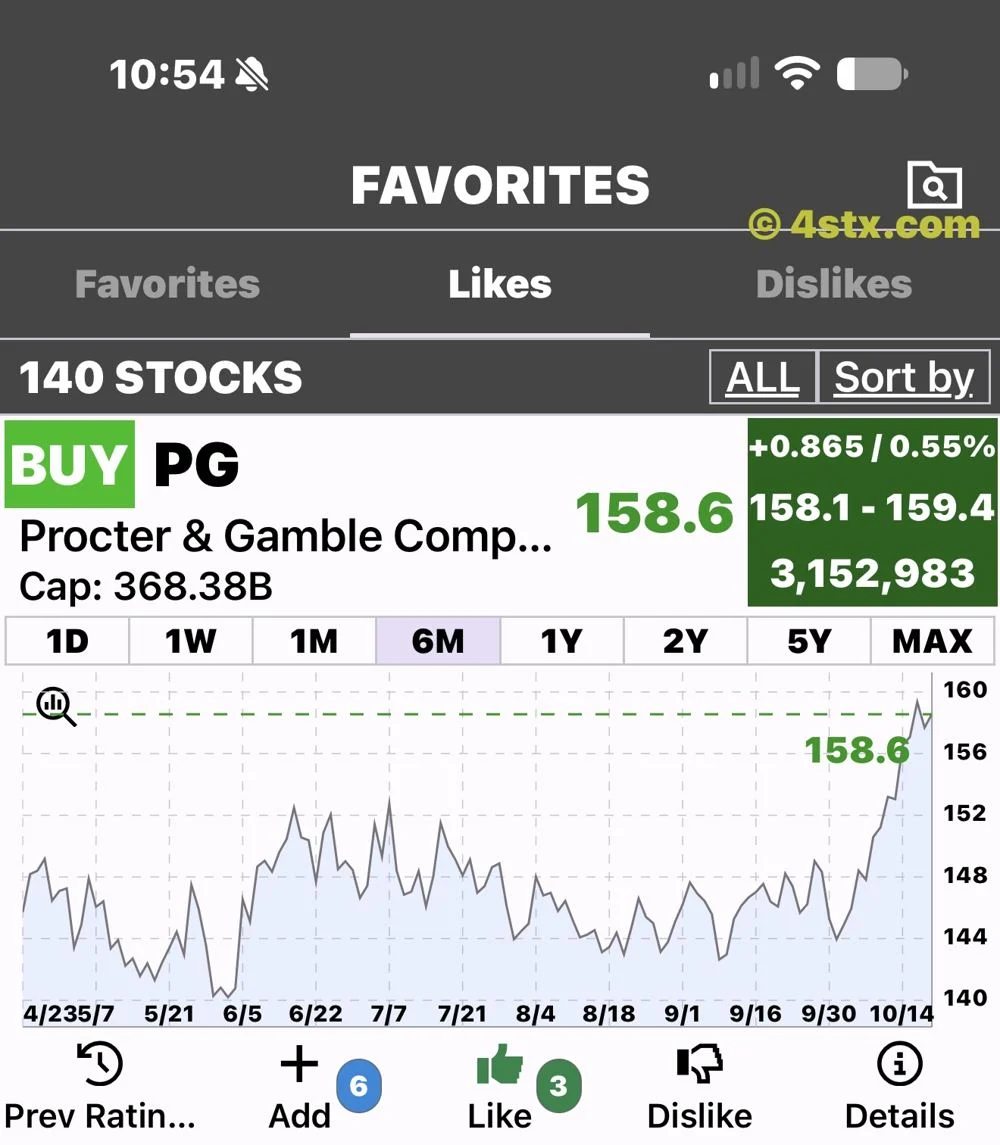
The Favorites screenshot has the six-month view selected and displays PG at 158.6, with market capitalization of 368.38 billion. Its plotted path fluctuates around the 140–152 area for much of the window before rising sharply near the right edge.
The daily panel shows +0.865 / 0.55%, a range of 158.1–159.4 and volume of 3,152,983. These are readings from the supplied image, not a live price or an independently verified closing quote. The visible phone clock does not establish a capture date or market timezone.
A rising line does not explain its own cause. The image cannot establish that earnings expectations, consumer demand or any single announcement produced the move. The green BUY badge is StockRank’s assessment, not a recommendation from this article.
Company details put the quote in context
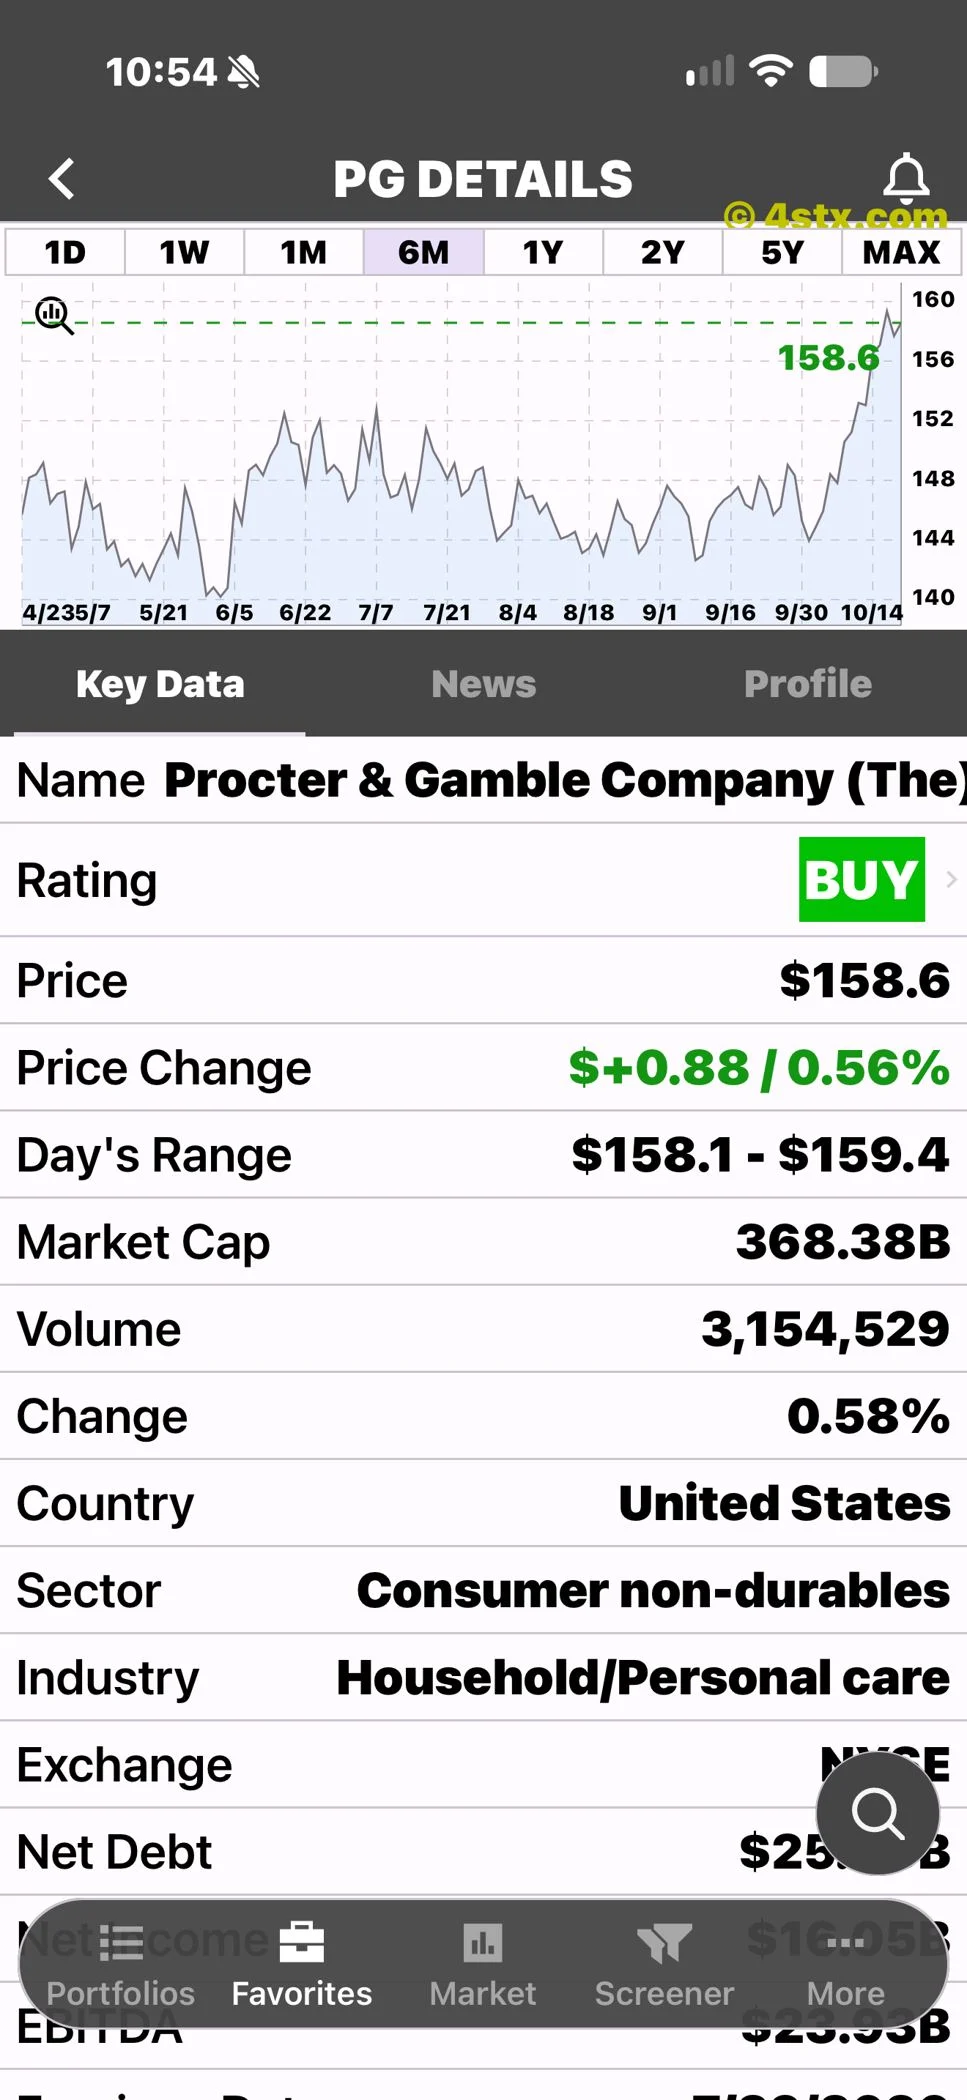
The first Key Data screen identifies Procter & Gamble, the United States, the NYSE, a consumer non-durables sector and a household/personal-care industry classification. These labels connect the ticker to the underlying business rather than treating it as just a price symbol.
This screen shows $158.6, a price change of +$0.88 / 0.56%, volume of 3,154,529 and a separate Change field of 0.58%. Those readings differ slightly from the Favorites panel. The screenshots do not establish whether refresh timing, rounding or another process explains the differences.
The appropriate description is therefore what each screen displays, rather than combining the numbers into a supposedly exact market record. Some lower fields are obscured by the app’s navigation overlay; hidden digits should not be guessed.
Valuation and earnings dates answer different questions
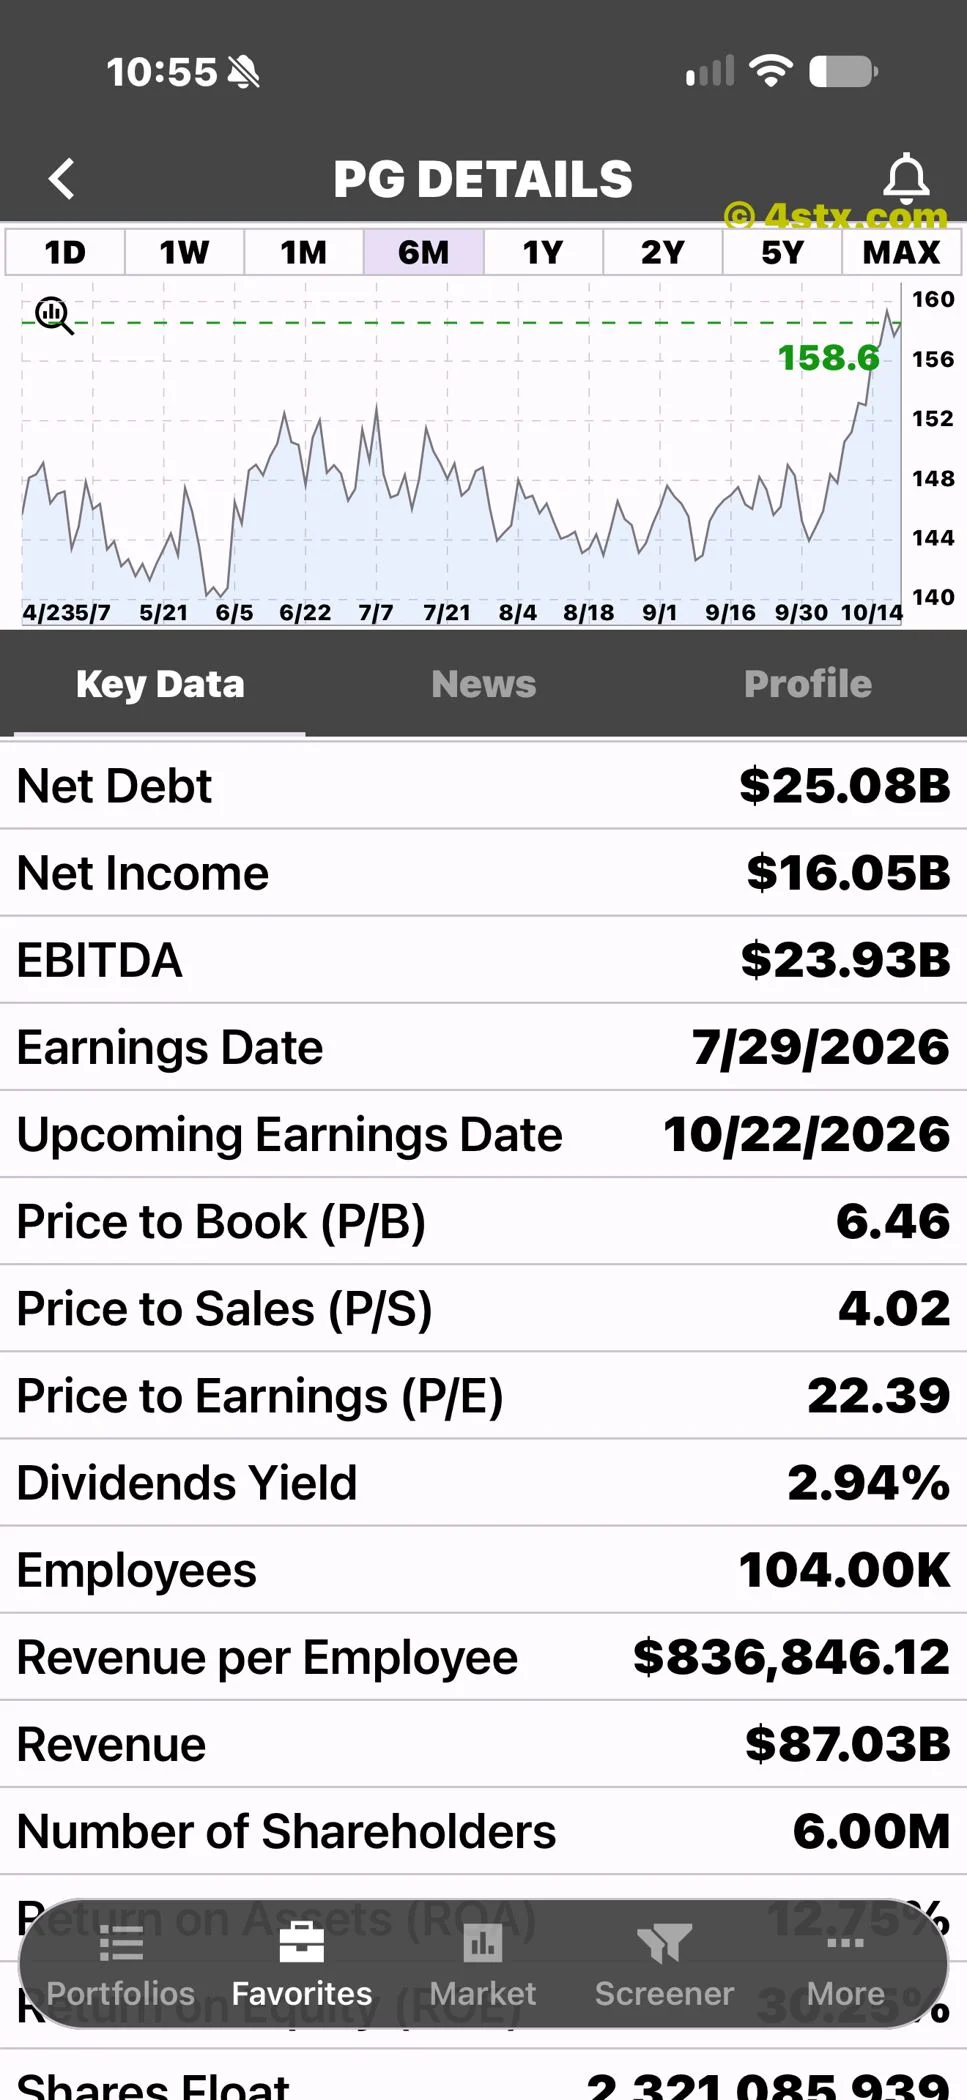
The next screen displays net debt of $25.08 billion, net income of $16.05 billion, EBITDA of $23.93 billion and revenue of $87.03 billion. It also lists 104,000 employees, revenue per employee of $836,846.12 and a Number of Shareholders field of 6.00 million.
Its valuation fields show price-to-book of 6.46, price-to-sales of 4.02, price-to-earnings of 22.39 and dividend yield of 2.94%. These are app-displayed figures with reporting periods and calculation methods not established by the screenshot. They should not be presented as newly reported quarterly results or a guarantee of future income.
The calendar lists July 29, 2026, as the earnings date and October 22 as the upcoming date. P&G’s dated releases independently support the July results announcement and the October 22 webcast.
For verified context, P&G’s July release reported fiscal-2026 net sales of approximately $87.0 billion, up 3%, and diluted earnings per share of $6.62, up 2%. Fourth-quarter sales increased 2% to $21.2 billion while organic sales were flat. Those company-reported measures provide a baseline for the next release.
Profitability and historical extremes need careful reading
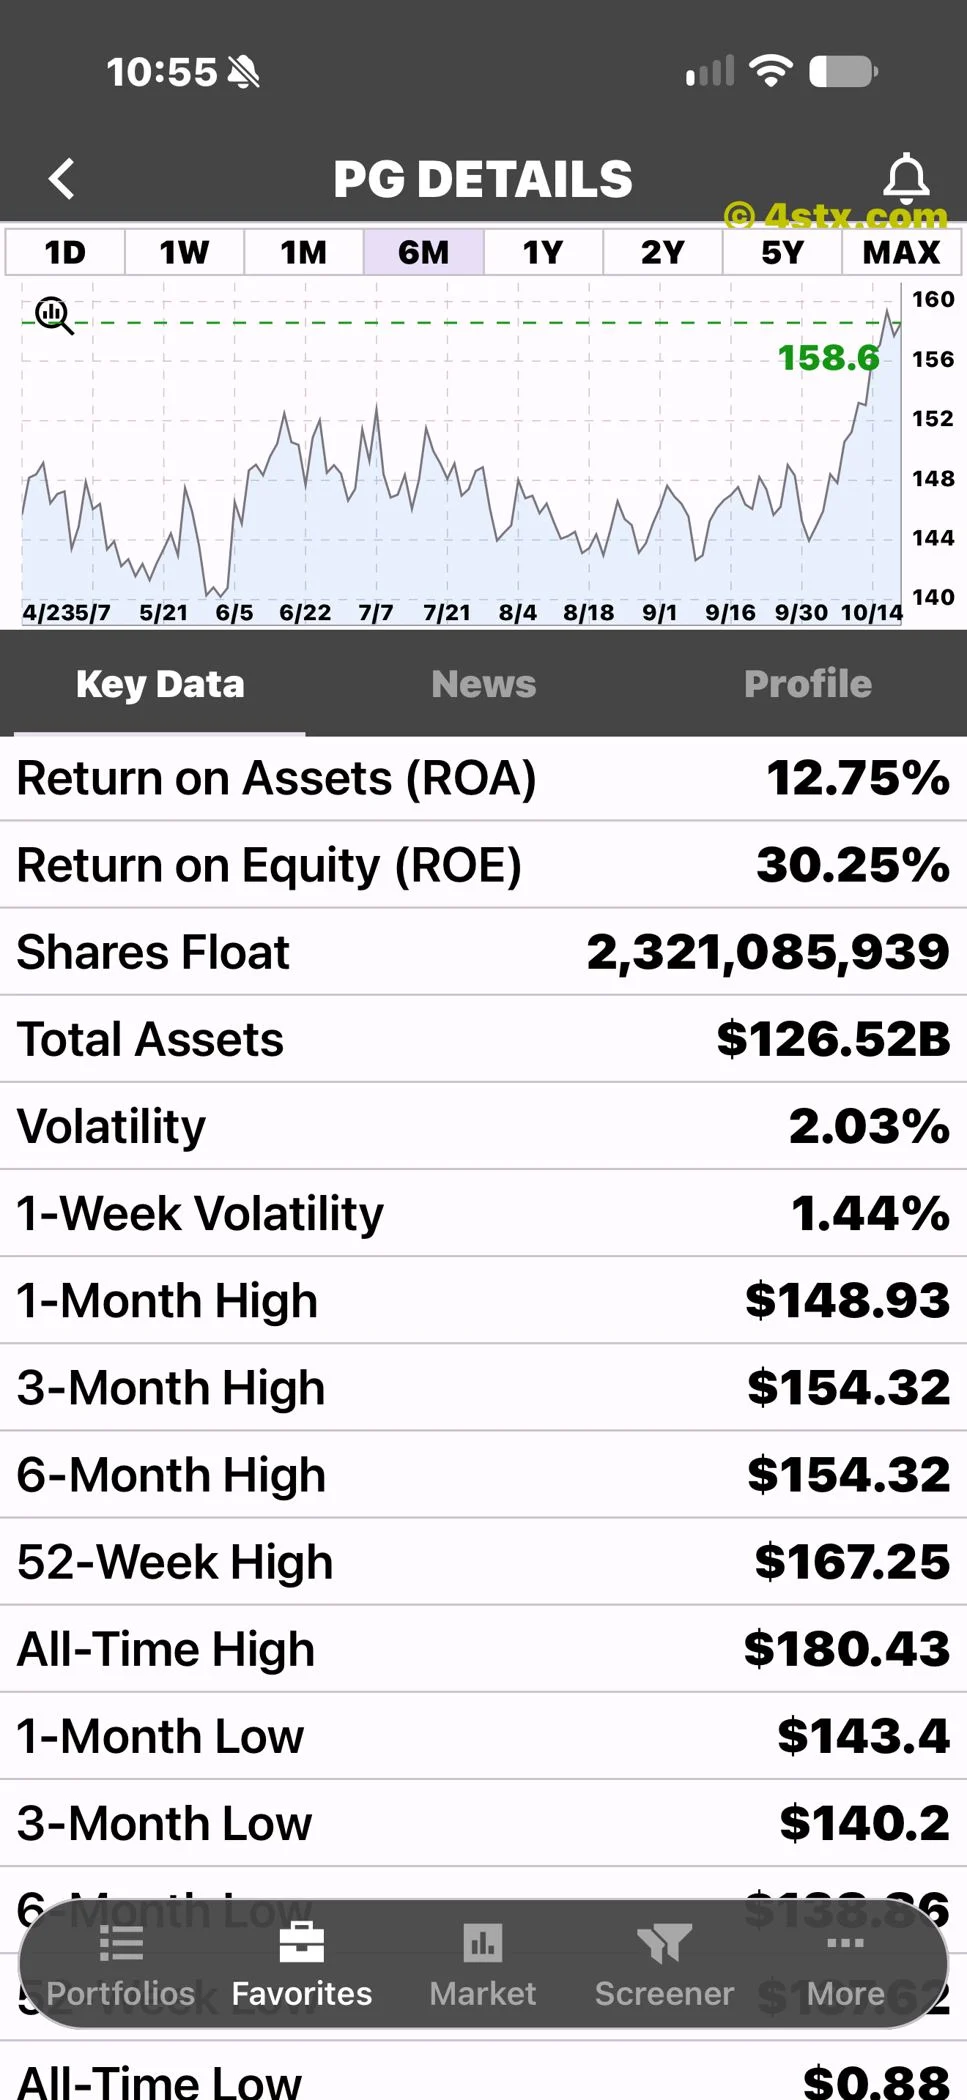
Another Key Data screen displays return on assets of 12.75%, return on equity of 30.25%, shares float of 2,321,085,939 and total assets of $126.52 billion. ROA and ROE relate earnings to different balance-sheet bases; neither is the return earned by someone holding PG shares.
The same screen lists volatility of 2.03%, one-week volatility of 1.44%, a 52-week high of $167.25 and an all-time high of $180.43. The periods and methodology behind the volatility readings are not supplied.
There is also a visible inconsistency: its six-month high is $154.32, below the displayed $158.60 quote. Its one-month high is $148.93. Readers should verify freshness and definitions before using these fields to calculate distance from a high. A screenshot preserves what the app showed; it does not reconcile every field.
Performance changes with the measurement window
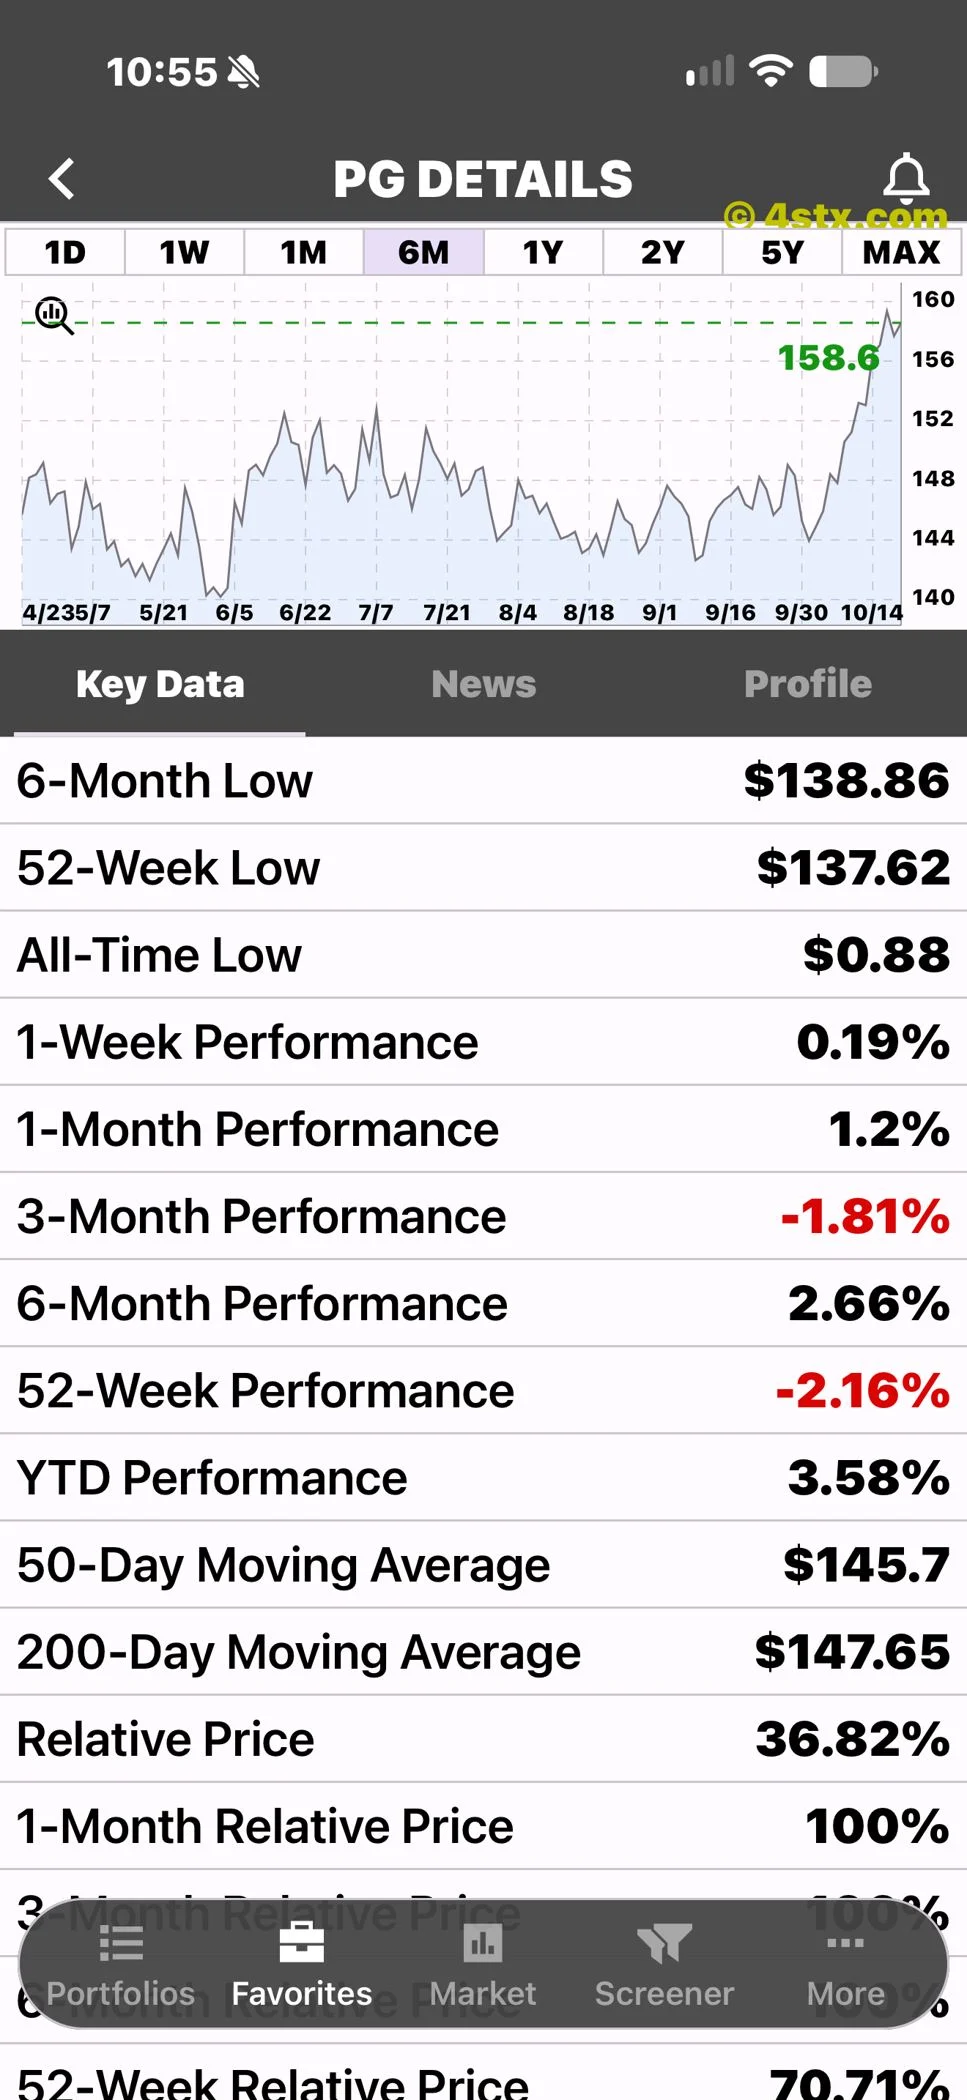
The performance screen shows 0.19% for one week, 1.2% for one month, -1.81% for three months, 2.66% for six months, -2.16% for 52 weeks and 3.58% year to date. Positive and negative readings can coexist because each comparison starts at a different point.
It also lists a 50-day moving average of $145.7 and a 200-day average of $147.65. These summarize past prices, rather than establish the next direction. The screen’s Relative Price fields should not be confused with investment returns.
Visible lows include $138.86 over six months and $137.62 over 52 weeks. The displayed all-time low of $0.88 needs historical adjustment and methodology context before comparison with today’s nominal quote. None of these app readings is used here to forecast a trade.
The profile connects PG to the household basket
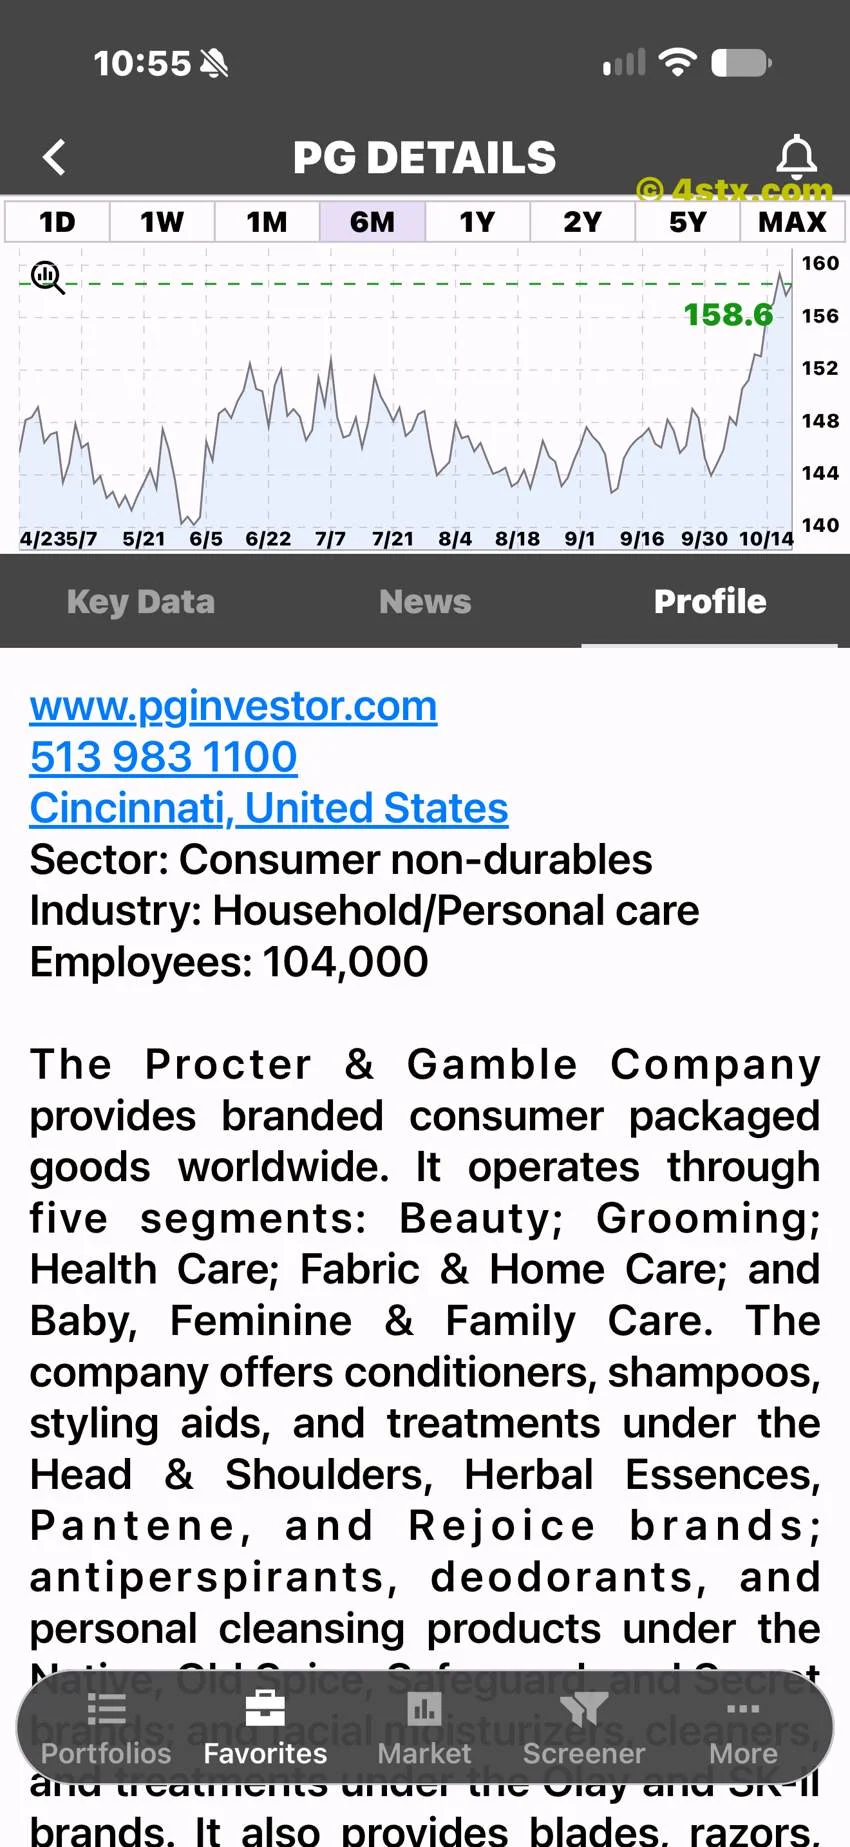
The Profile screen identifies Cincinnati and links to pginvestor.com. It describes a worldwide consumer-products business spanning beauty, grooming, health care, fabric and home care, and baby, feminine and family care.
That range explains why PG is relevant to a consumer-budget story. However, a company-wide sales increase is not a direct measure of the price change in one shopper’s basket. Product mix, quantities and geography matter.
When the next release arrives, the useful questions concern sales growth, volumes, pricing and profitability. The screenshots organize that research; the original disclosures establish the reported operating results.
Explore PG in the StockRank app
All six images were supplied by the user from the StockRank mobile app and retain the visible 4stx.com watermark. The six-month Favorites chart is the main cover image and also appears within this article.
Readers can download StockRank for iPhone through the Apple App Store and for Android through Google Play using the direct links in Sources & further reading. The app’s charts, details and profile screens provide starting points for investigation; its trading labels remain the app’s own assessments.