AT&T (NYSE: T) connects two everyday financial decisions: what households pay for communications and what shareholders expect from the company supplying them. Its latest results make the relationship between customer growth, network spending and available cash worth examining.
In its October 21, 2026 release, AT&T reported 442,000 fiber net additions and 327,000 fixed-wireless net additions for the third quarter. The distinction matters: the combined internet total is not entirely fiber. The company also reported $5.0 billion in free cash flow, a non-GAAP measure with a reconciliation in its earnings materials.
What customers and investors should compare
A household choosing internet service should compare the complete recurring bill, terms and availability at its address. A shareholder asks a different question: whether adding customers produces durable returns after the spending required to serve them.
These questions are connected, but they are not identical. More connections do not automatically mean that every household receives a lower bill. Likewise, an expanding network does not by itself establish that the stock offers an attractive return. The useful analysis follows both the customer relationship and the cash required to support it.
AT&T’s earnings package includes operational schedules and non-GAAP reconciliations. Those documents provide a dated framework for checking the company’s financial story. The accompanying StockRank screens demonstrate a practical way to begin researching the ticker before consulting those original disclosures.
Reading the six-month chart and quote
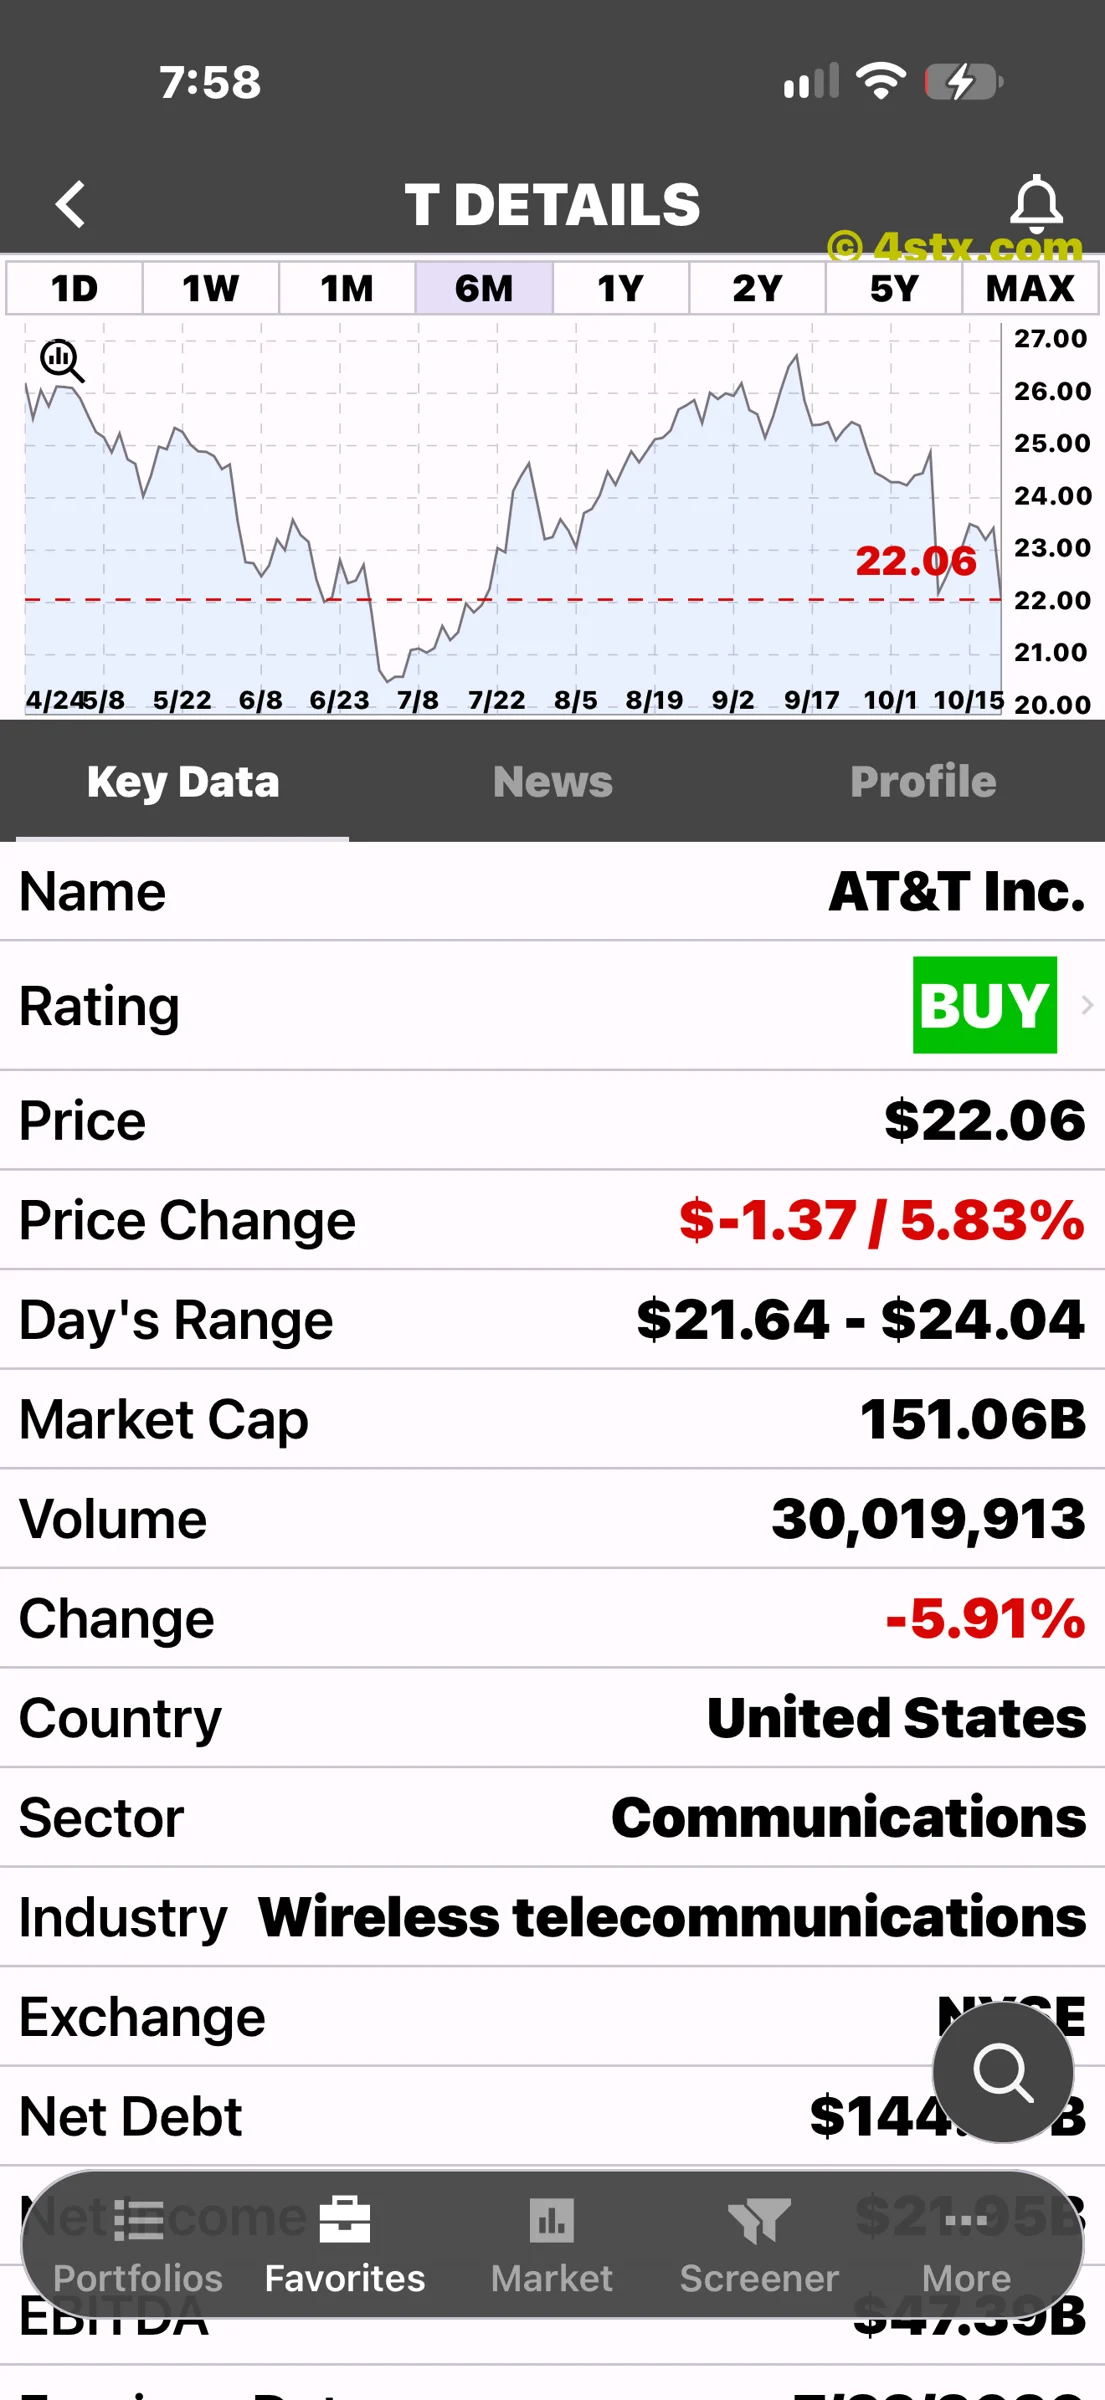
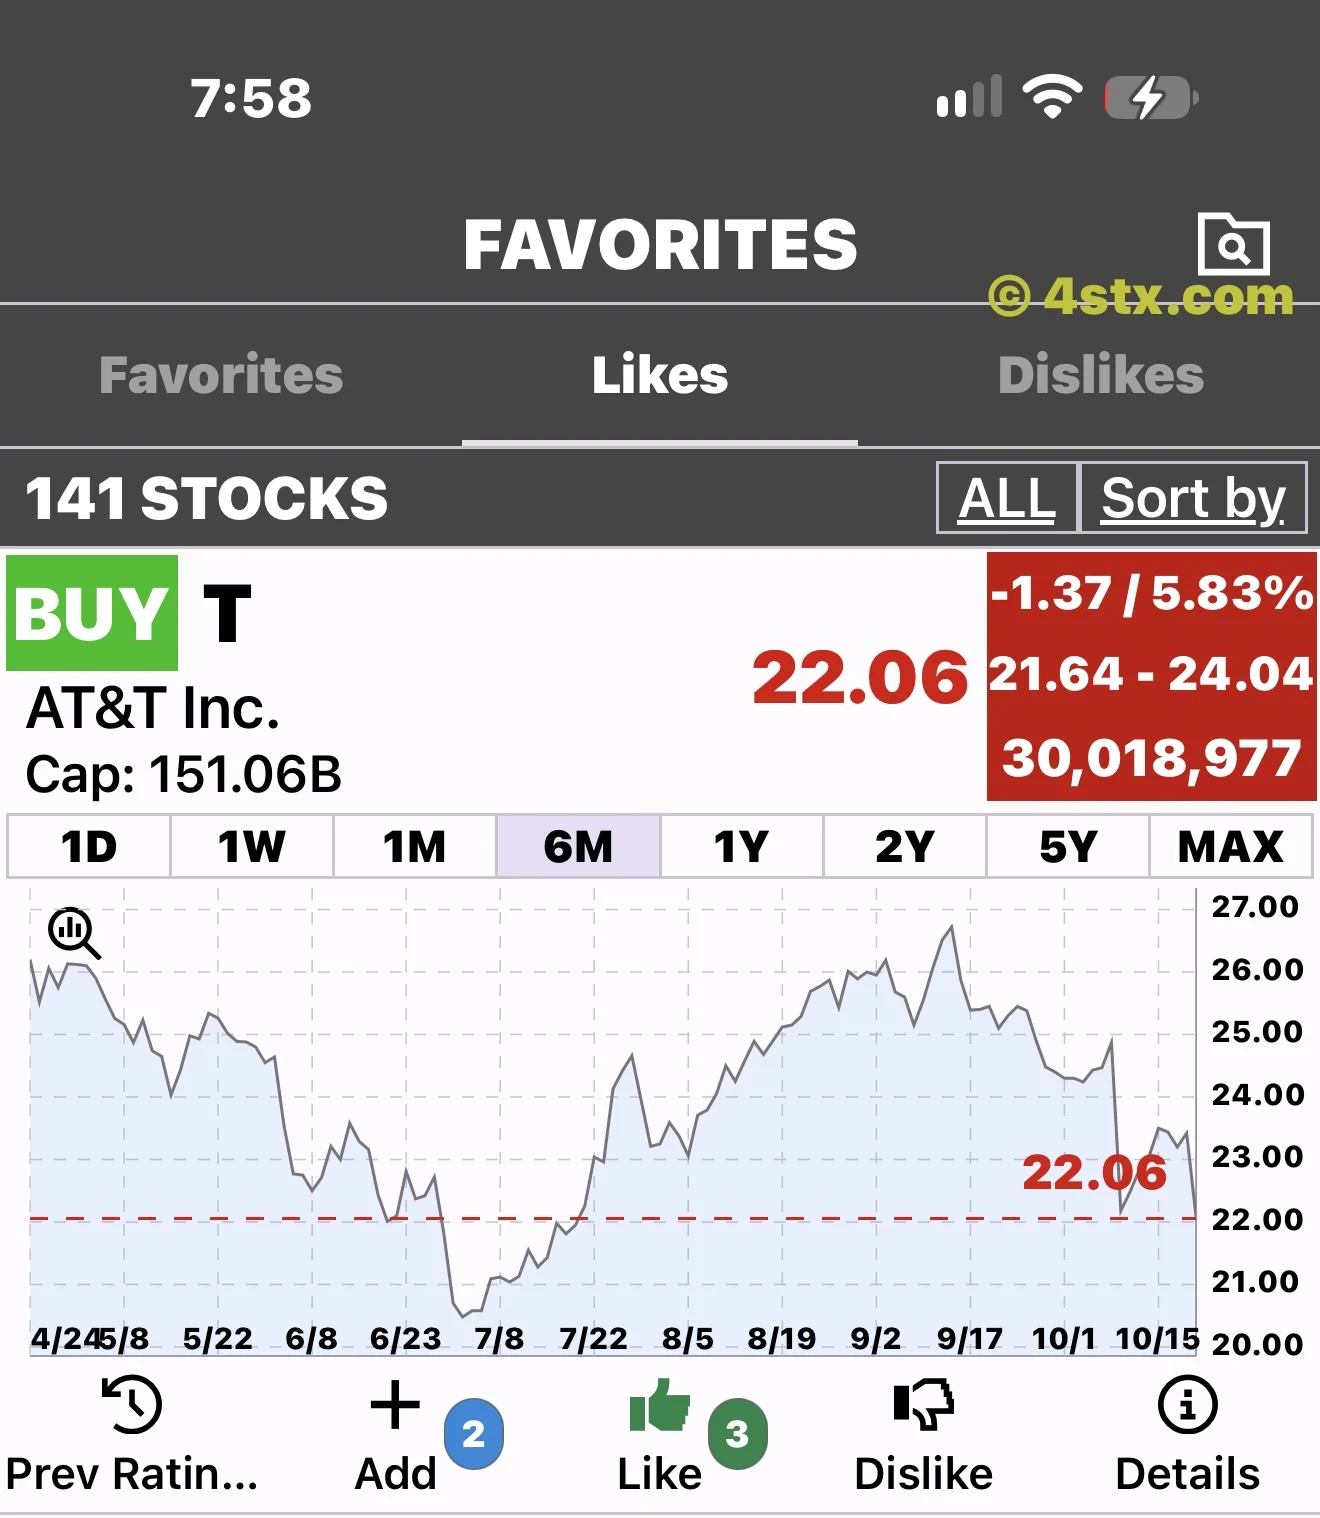
The main screenshot has the six-month chart selected and shows T at $22.06, alongside a BUY label and a displayed daily decline of 5.83%. The company-details screen shows a $21.64–$24.04 day’s range, market capitalization of $151.06 billion and volume of 30,019,913.
These are user-supplied snapshots, not live quotes or verified closing prices. The cover’s volume differs slightly from the details screen, and another change field reads -5.91%. The images do not establish why those fields differ. The BUY label belongs to the app and is not an endorsement by this article.
Financial data and dividend context
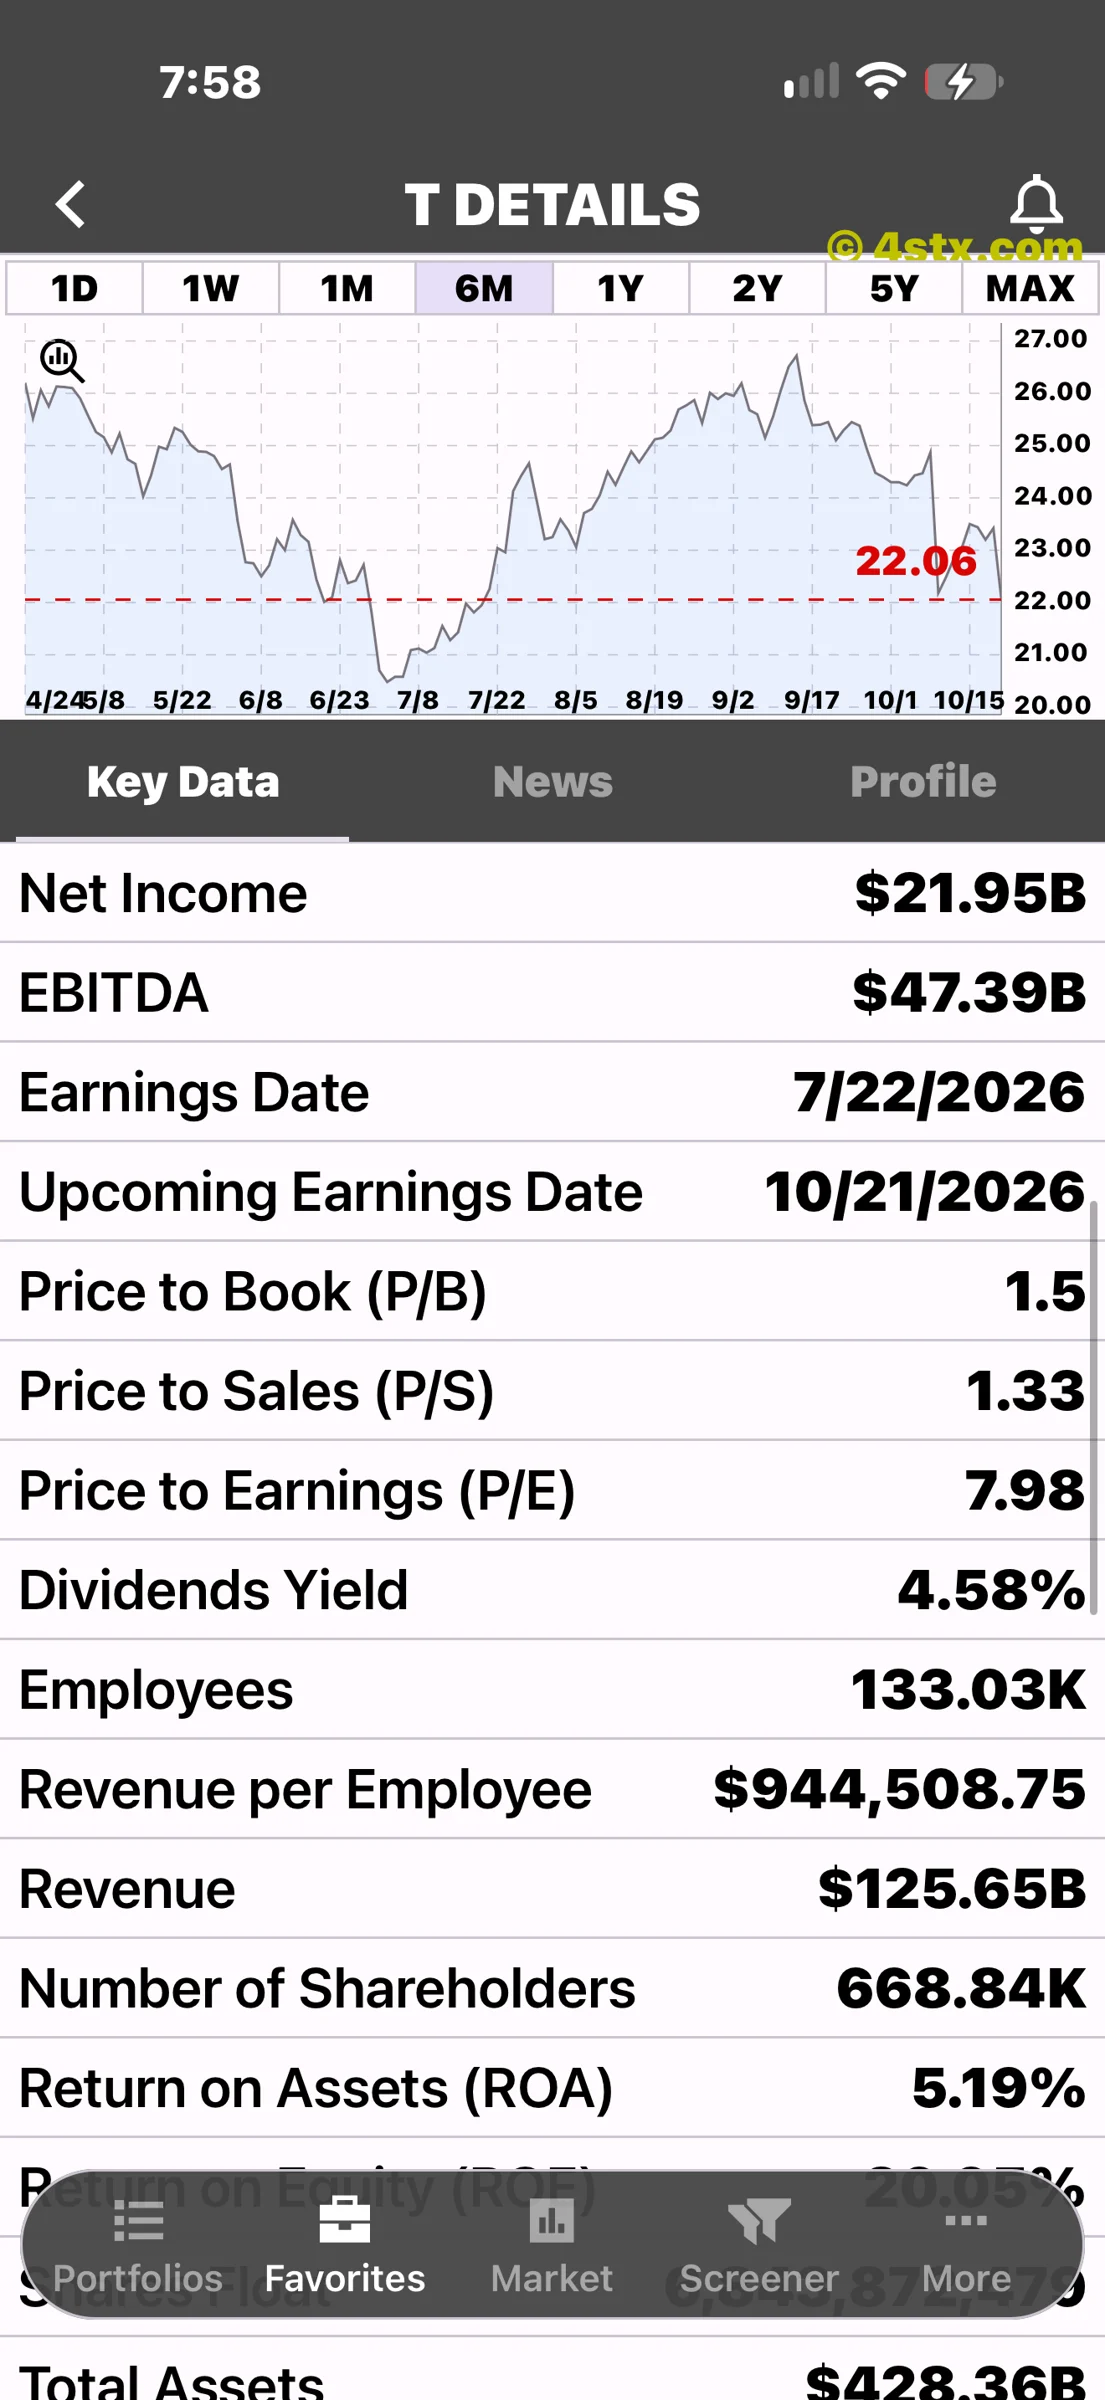
The financial screen displays net income of $21.95 billion, EBITDA of $47.39 billion and revenue of $125.65 billion. It lists P/E of 7.98, price-to-book of 1.5, price-to-sales of 1.33 and dividend yield of 4.58%.
These displayed fields are not identified as the newly announced quarter. They should not be substituted for quarterly results or mixed with differently dated financial measures. A dividend yield also depends on its price and dividend inputs; the screenshot does not promise a future payment or return.
The earnings calendar still calls October 21 an upcoming date. The company’s release is dated October 21. That is a useful reminder to check the original reporting date when moving from an app screen to the latest results.
Performance changes with the measurement window
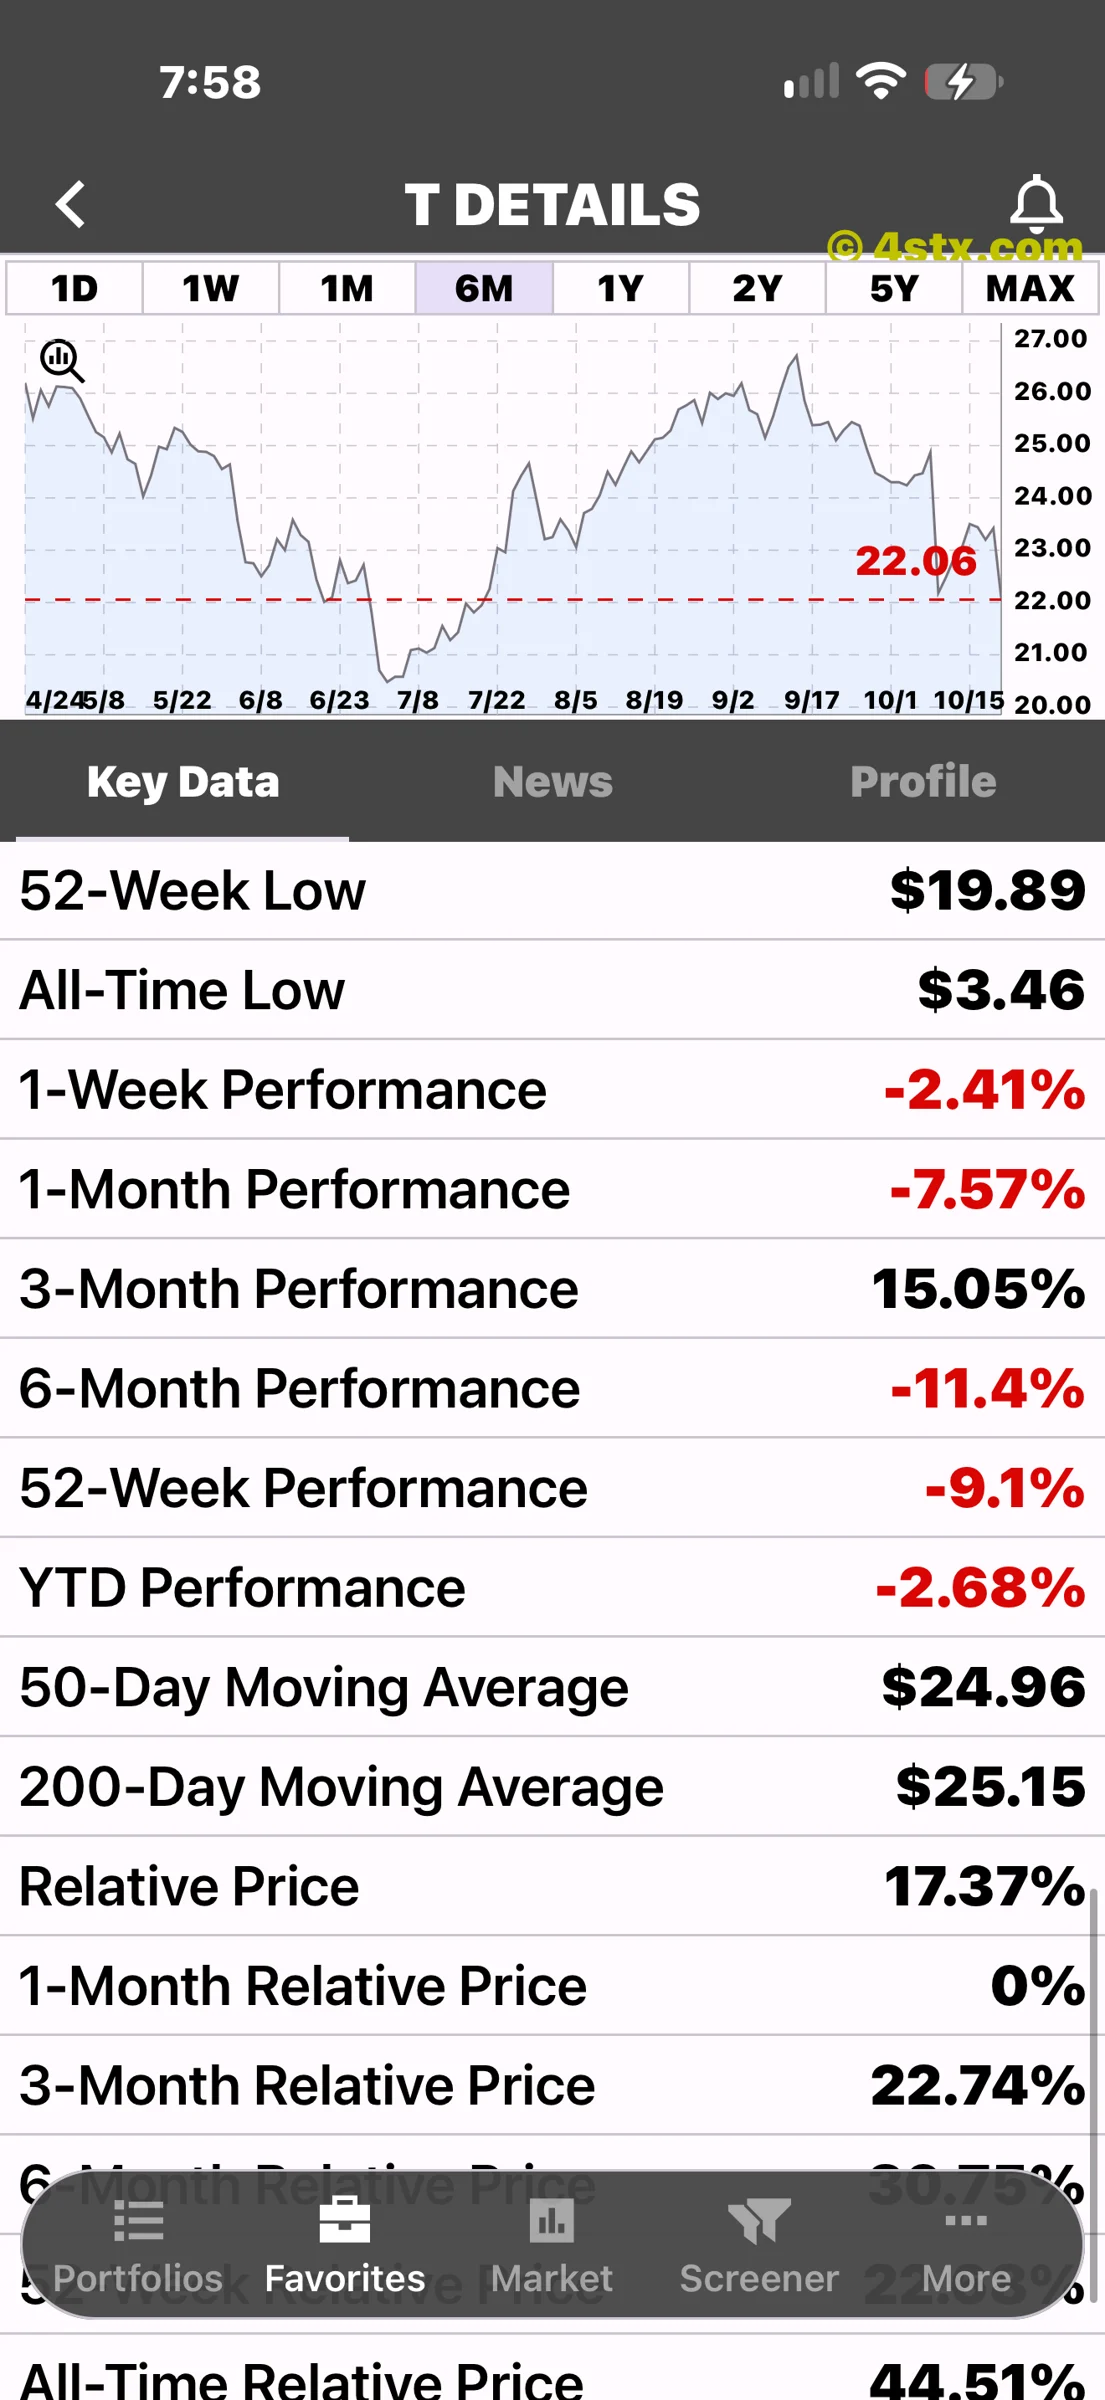
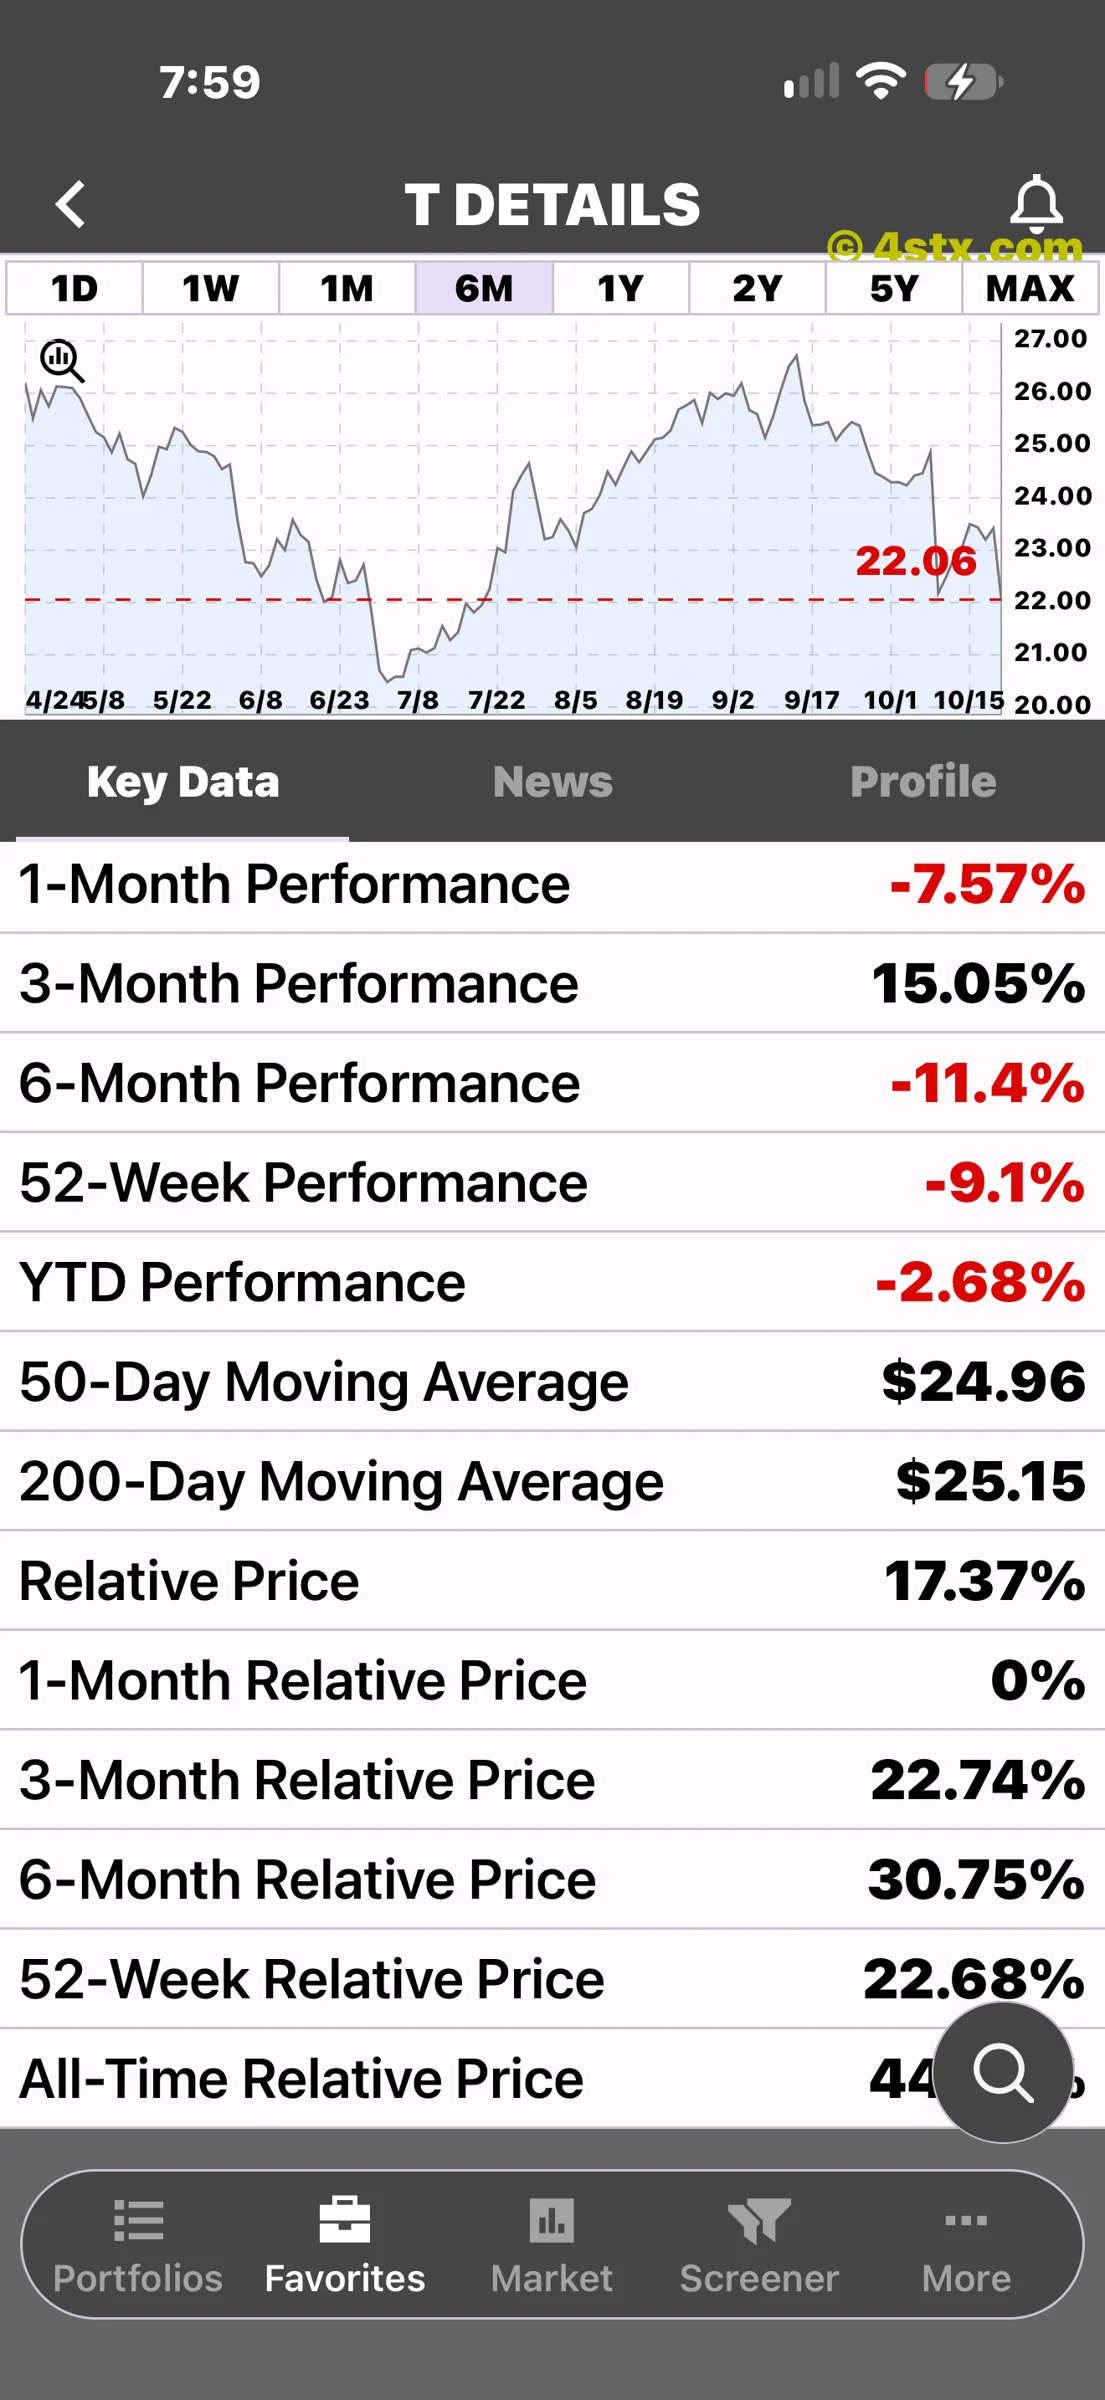
The two performance screenshots display a 52-week low of $19.89 and an all-time low of $3.46. They show one-week performance of -2.41%, one-month performance of -7.57%, three-month performance of 15.05% and six-month performance of -11.4%.
The second screen continues with 52-week performance of -9.1%, year-to-date performance of -2.68% and moving averages of $24.96 over 50 days and $25.15 over 200 days. The app’s relative-price fields are separate indicators; they should not be confused with investment returns.
Different windows can point in different directions. These fields illustrate the importance of choosing a consistent comparison period, rather than selecting only the most favorable number. The chart cannot independently prove what caused a price change.
The profile introduces the communications business
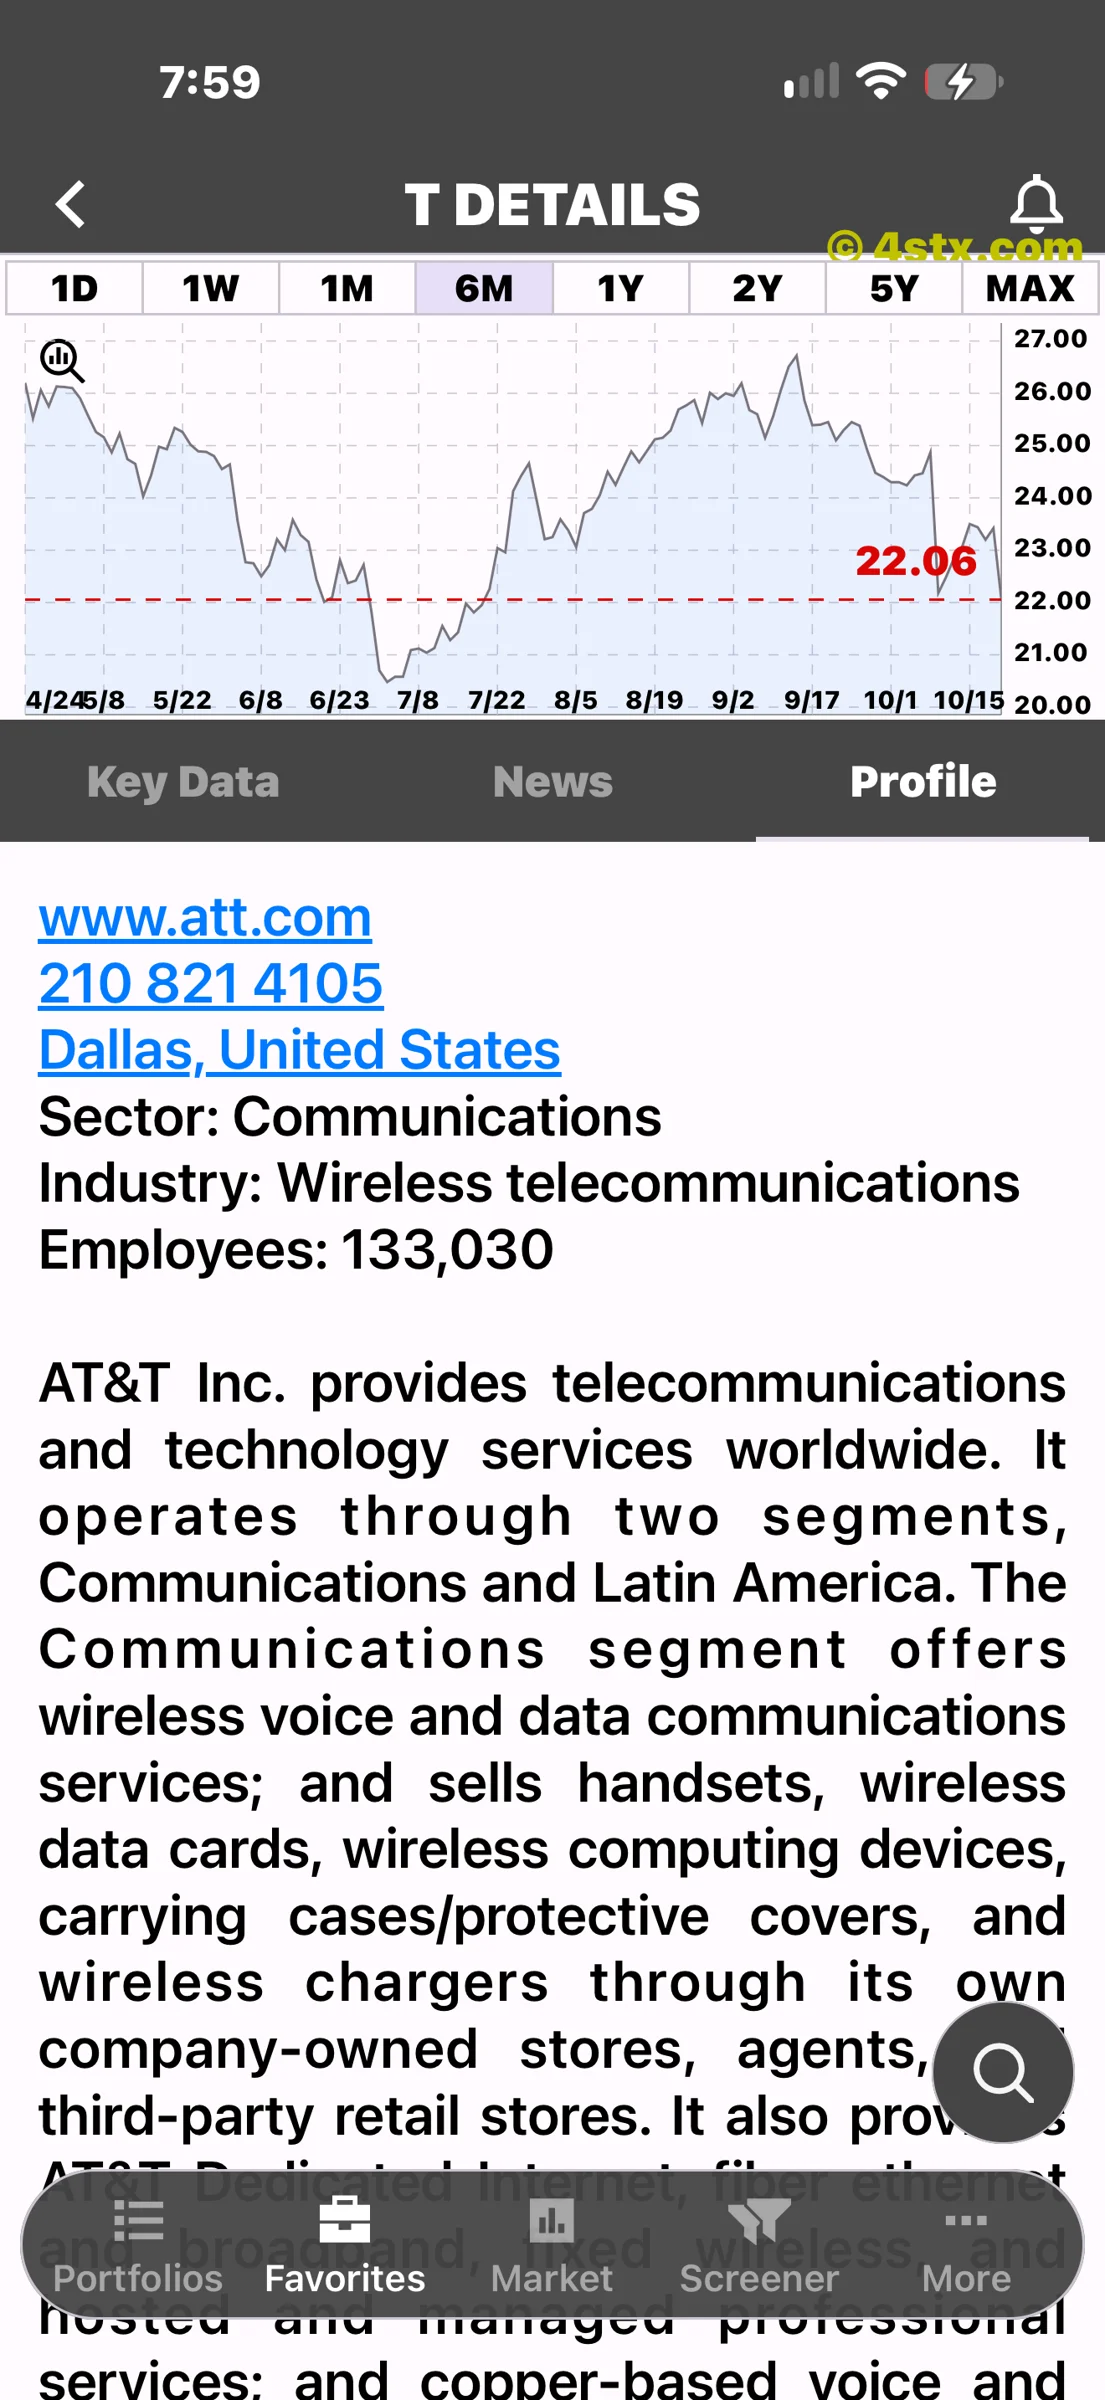
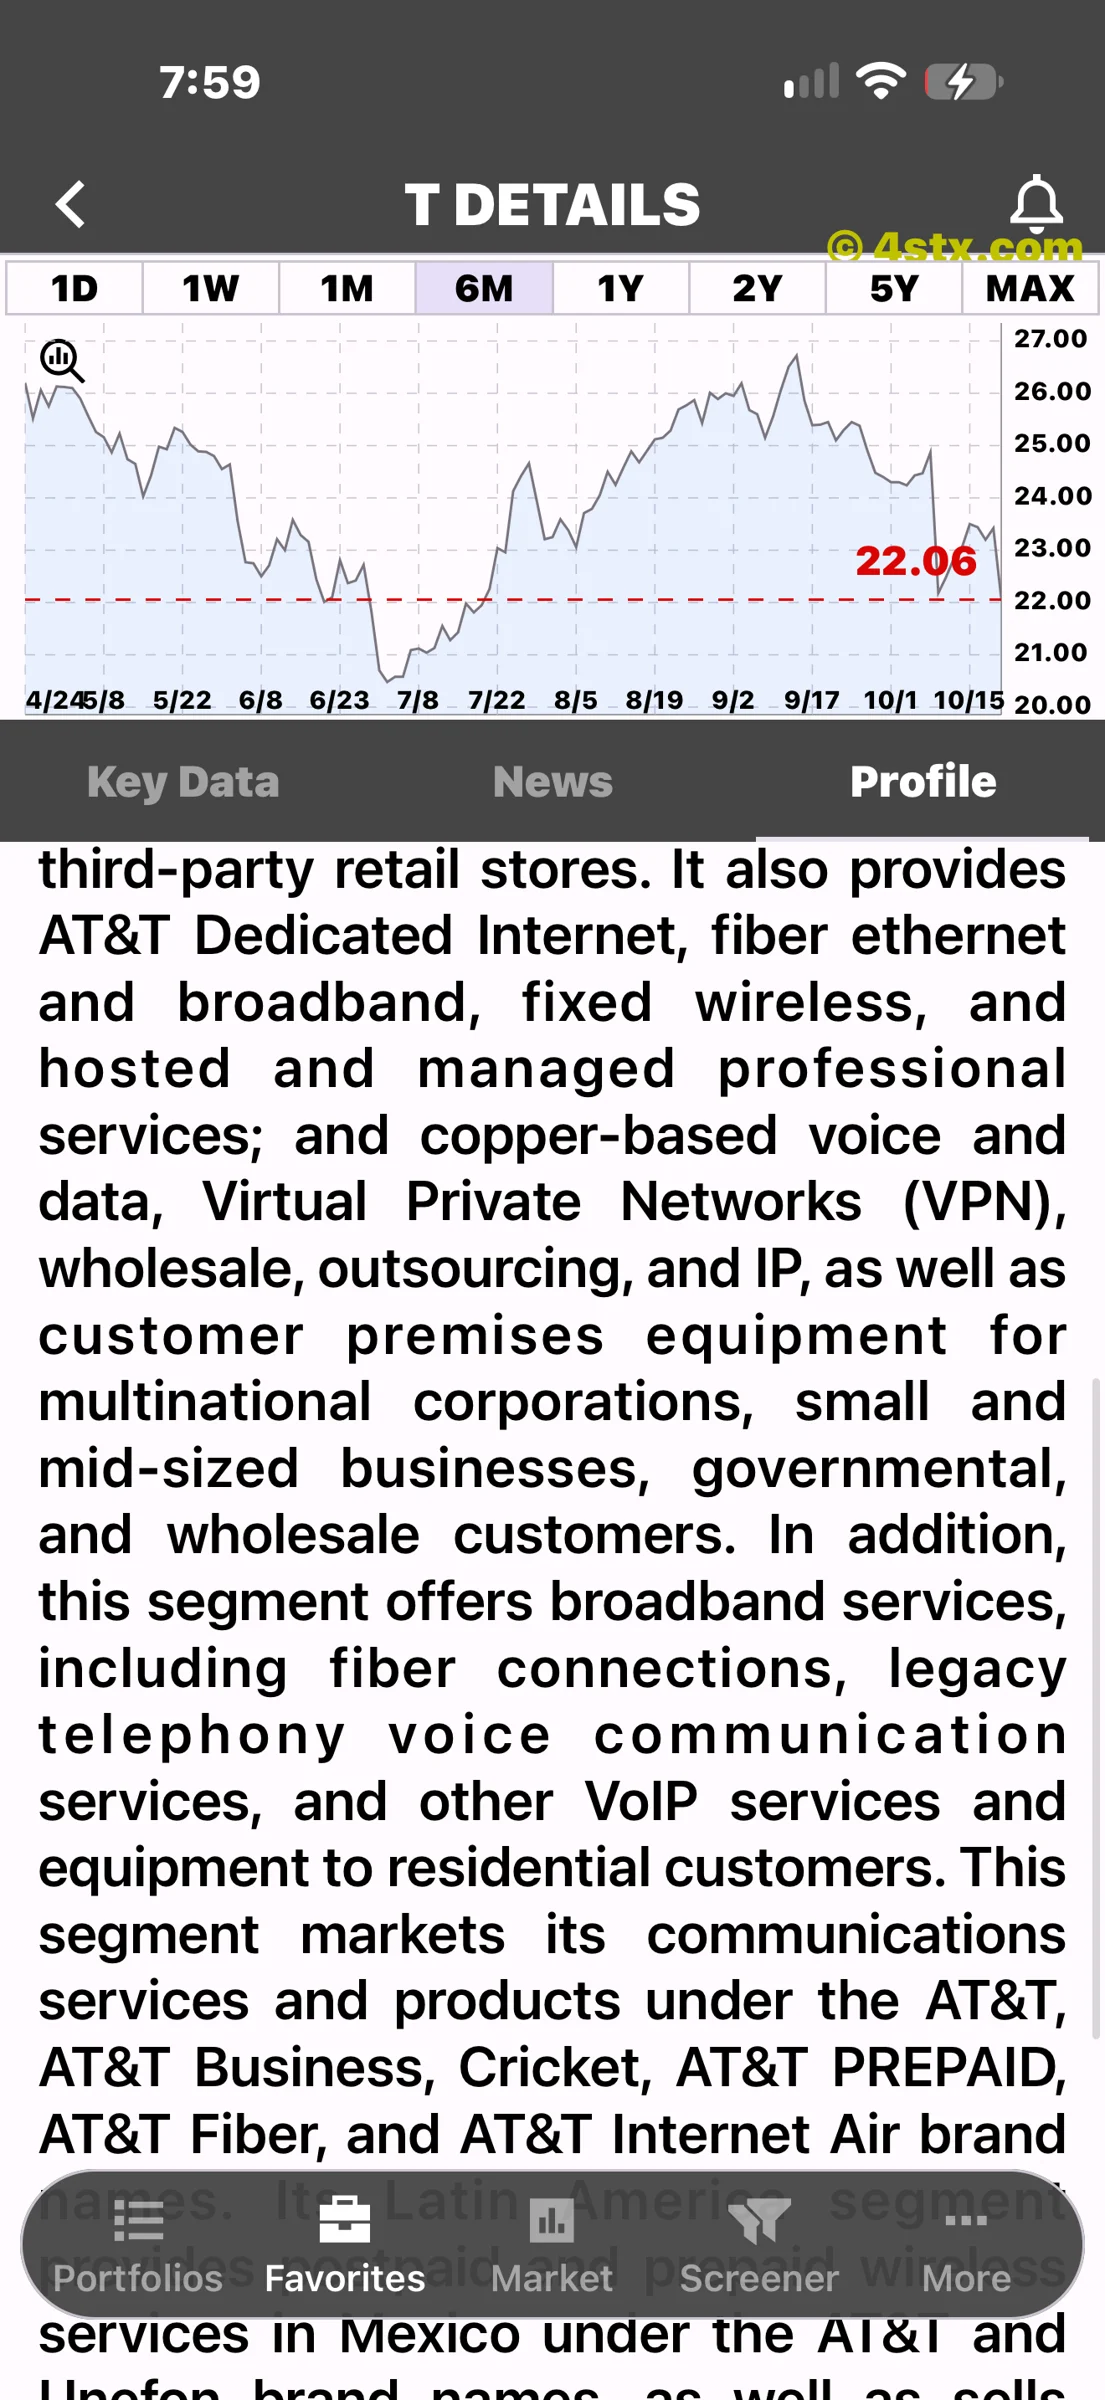
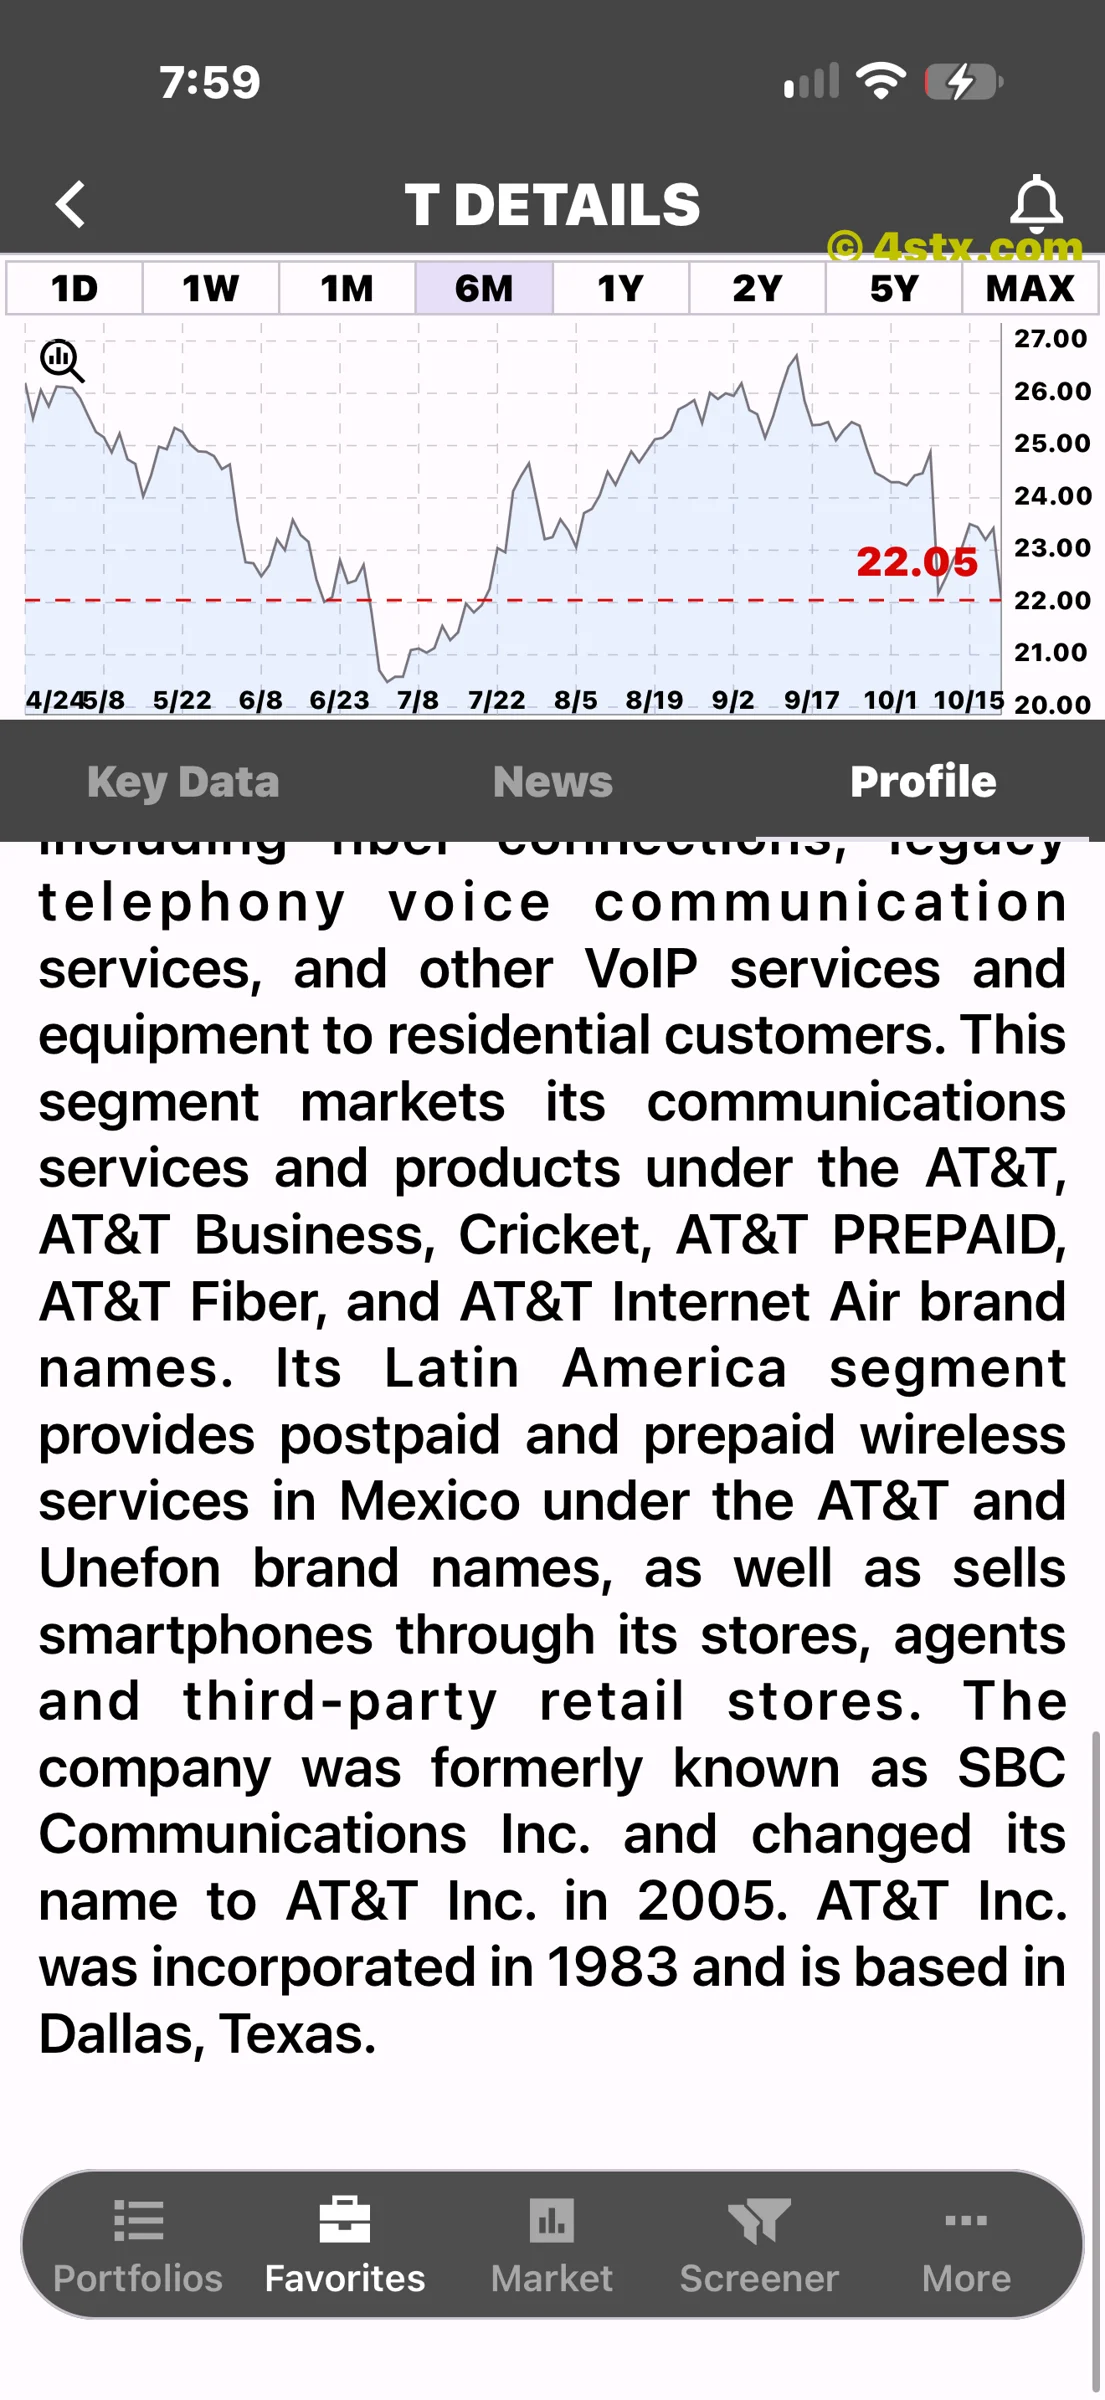
Three profile screenshots show the company website, Dallas location, a displayed workforce of 133,030 and descriptions of wireless, broadband, business services and consumer brands. The continuation screens describe fiber, fixed wireless, legacy voice services and Mexico operations.
These are descriptions visible in the captured profile. They are an introduction rather than confirmation that every organizational label is current. For current segment reporting and accounting definitions, consult the latest company materials. A broad profile and a dated earnings release serve different research purposes.
Check relevance before relying on a news result
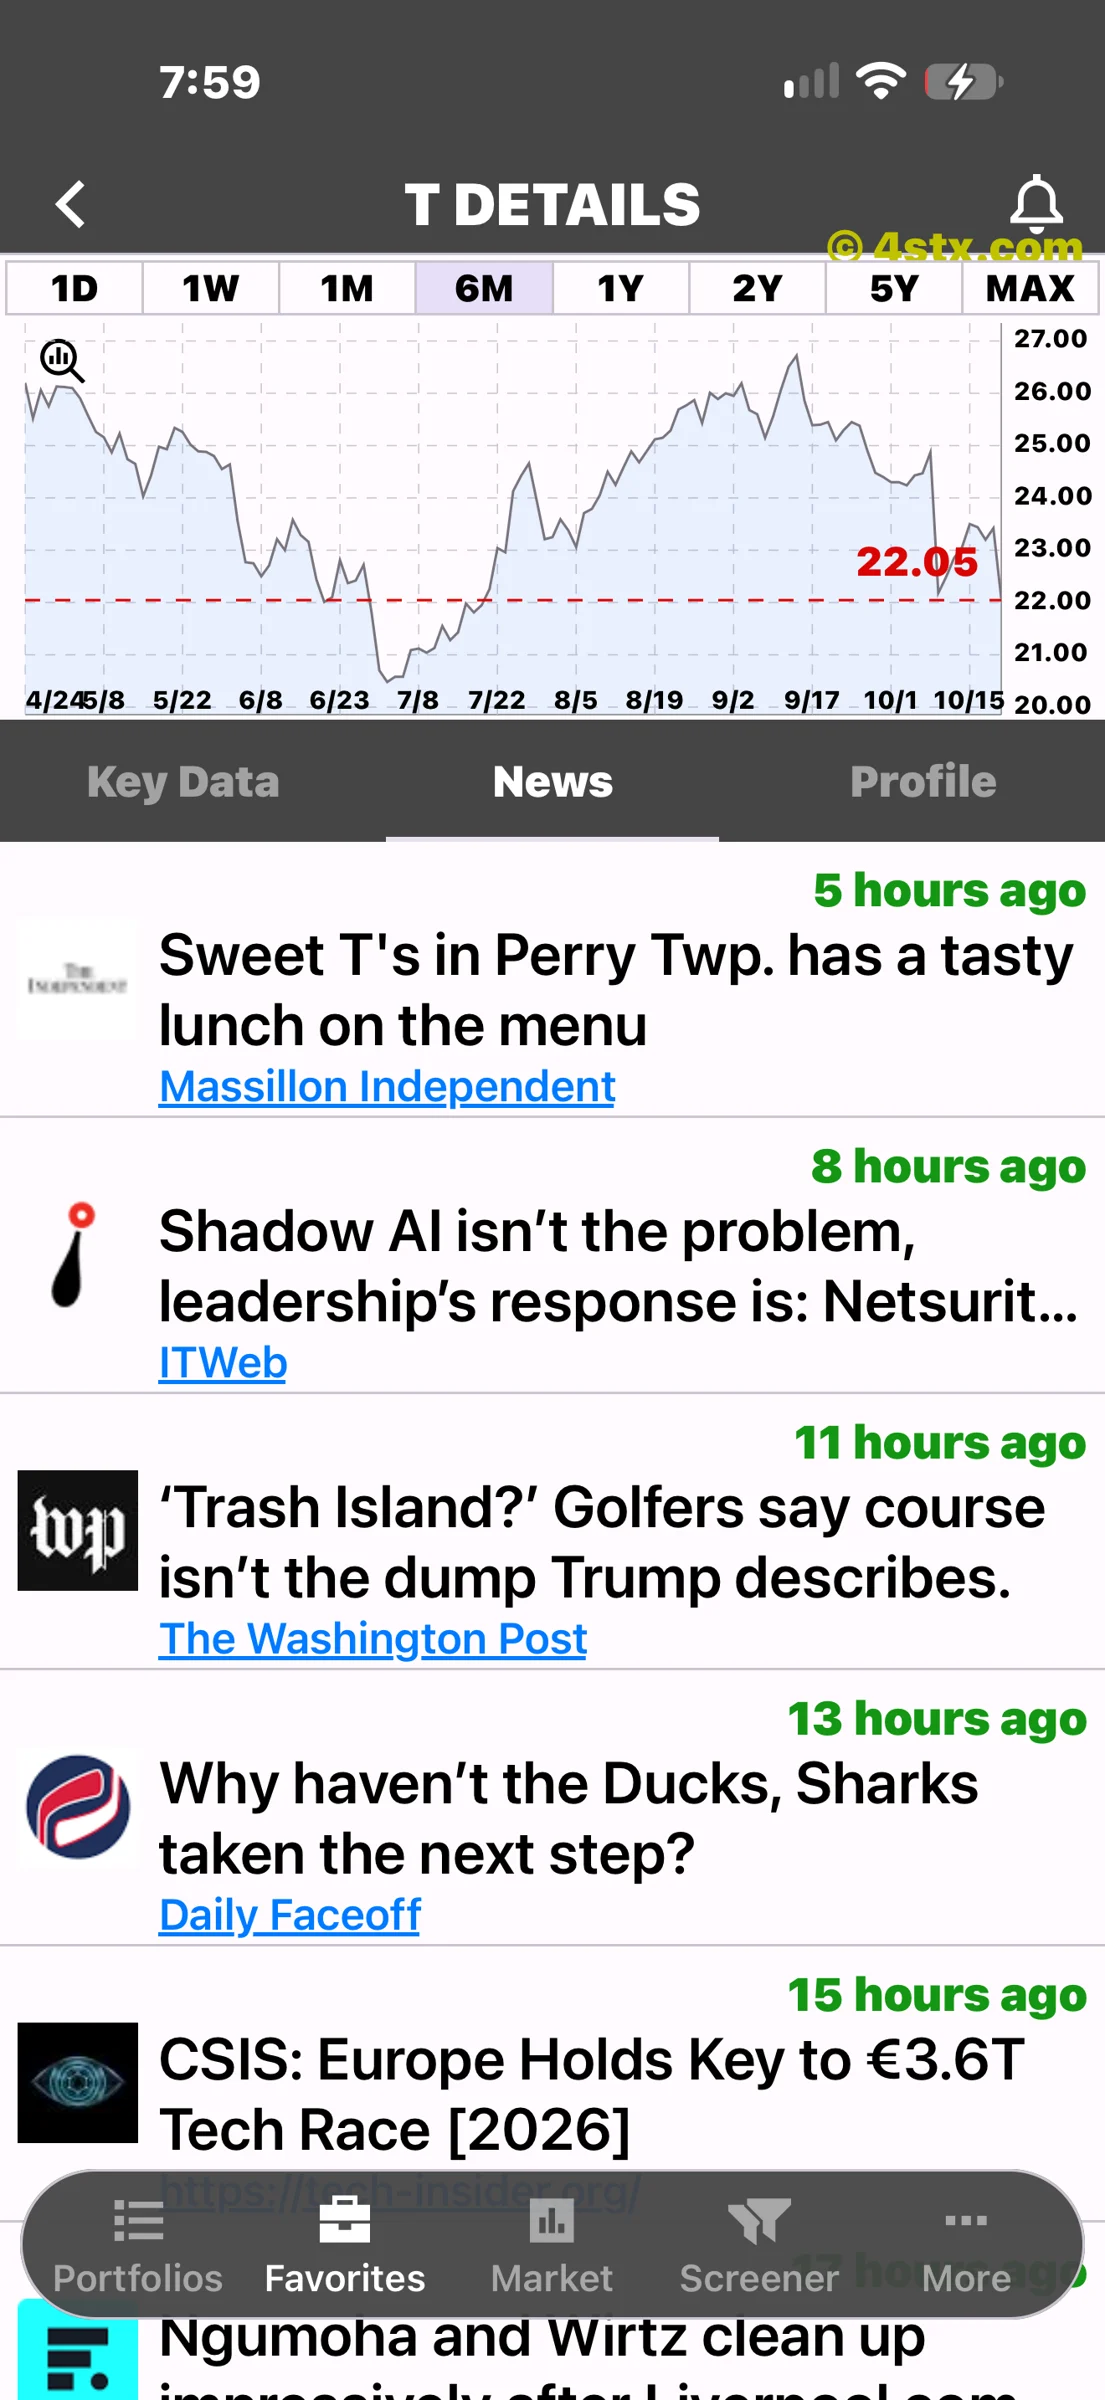
The supplied news screenshot includes a restaurant headline, sports headlines and other items that do not establish a connection to AT&T’s financial results. We include it as the requested view of the app’s news panel, not as supporting evidence for the earnings story.
For a single-letter ticker such as T, readers should verify that a news result actually concerns the intended company. Open the original source and check its subject, date and evidence before drawing a conclusion. Relative timestamps on a screenshot refer to that capture, not the moment this article is read.
Explore AT&T in StockRank
All nine images are authorized StockRank App screenshots: the main chart and eight supporting views. They demonstrate the chart, company details, financial data, performance, profile and news screens. Verified Apple App Store and Google Play download links are provided below.
For readers following AT&T, the next useful step is to connect subscriber growth with spending and cash generation, while keeping the household service decision separate from the investment decision.