IBM (NYSE: IBM) has supplied a useful reminder for anyone following the AI boom: selling more software and generating more cash are different achievements. In its latest quarter, the company reported progress on both.
IBM’s October 21, 2026 release reported third-quarter revenue of $17.1 billion, up 5%, and software revenue growth of 8%. Free cash flow was $3.0 billion, up $700 million year over year. IBM also raised its expectation for full-year free-cash-flow growth to more than $1 billion. That last figure is guidance, not cash already generated.
The cash register behind the AI story
A software contract, recognized revenue and cash available after investment do not necessarily arrive together. Investors who treat them as interchangeable can miss what a company’s results actually establish.
The question is not simply whether an AI-related business is getting larger. It is whether that growth produces cash after the spending required to support it. A company can expand sales while its cash generation follows another path. Comparing both measures over matching periods helps keep a compelling technology story grounded in financial outcomes.
IBM identifies free cash flow as a non-GAAP measure. Its definition and reconciliation matter when comparing it with another company’s similarly named figure.
What management says drove the quarter
In its prepared remarks, IBM attributed the year-to-date cash-flow improvement to higher adjusted EBITDA, partly offset by capital spending, cash taxes and net interest expense. That explanation connects the headline with the costs that sit between operating performance and cash generation.
It remains management’s explanation. Readers should examine the disclosed figures and follow the next reporting period rather than treating an improved outlook as a guaranteed result. The distinction is especially useful when an earnings headline mixes completed quarterly performance with expectations for the rest of the year.
Two charts, two different windows
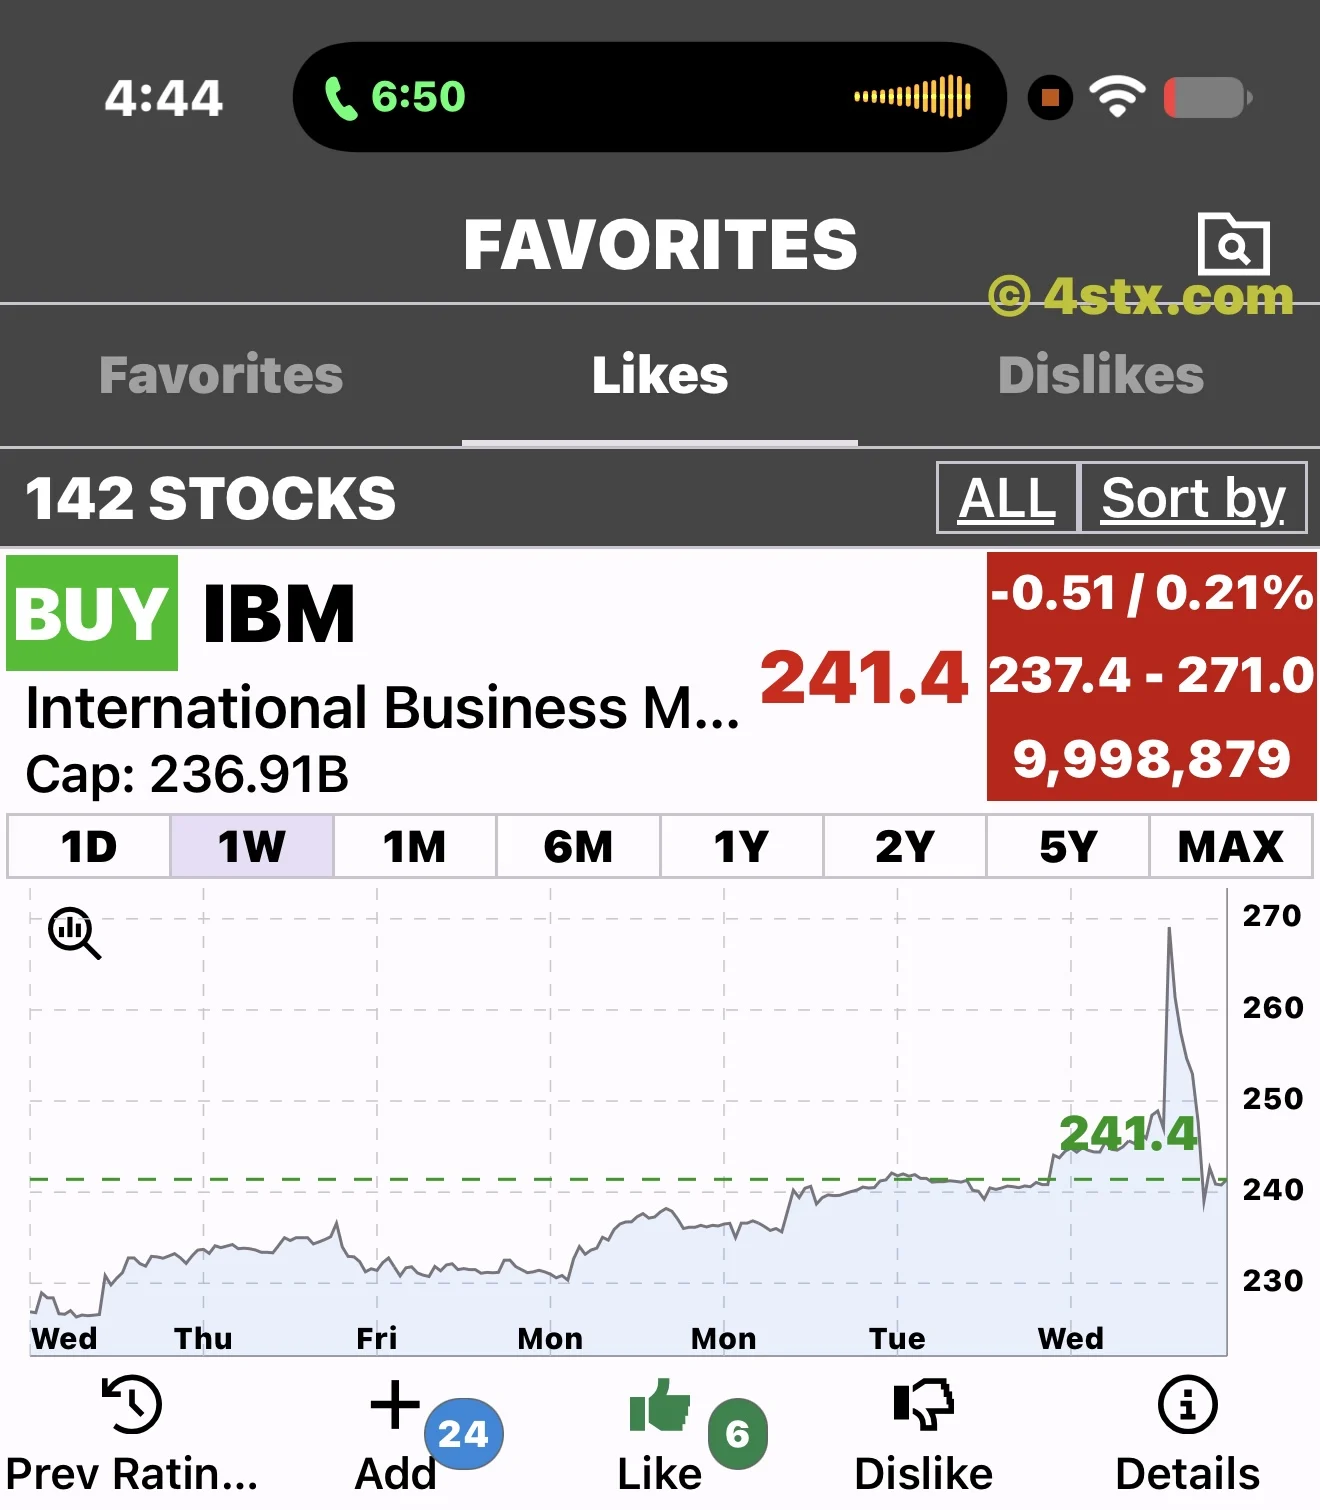
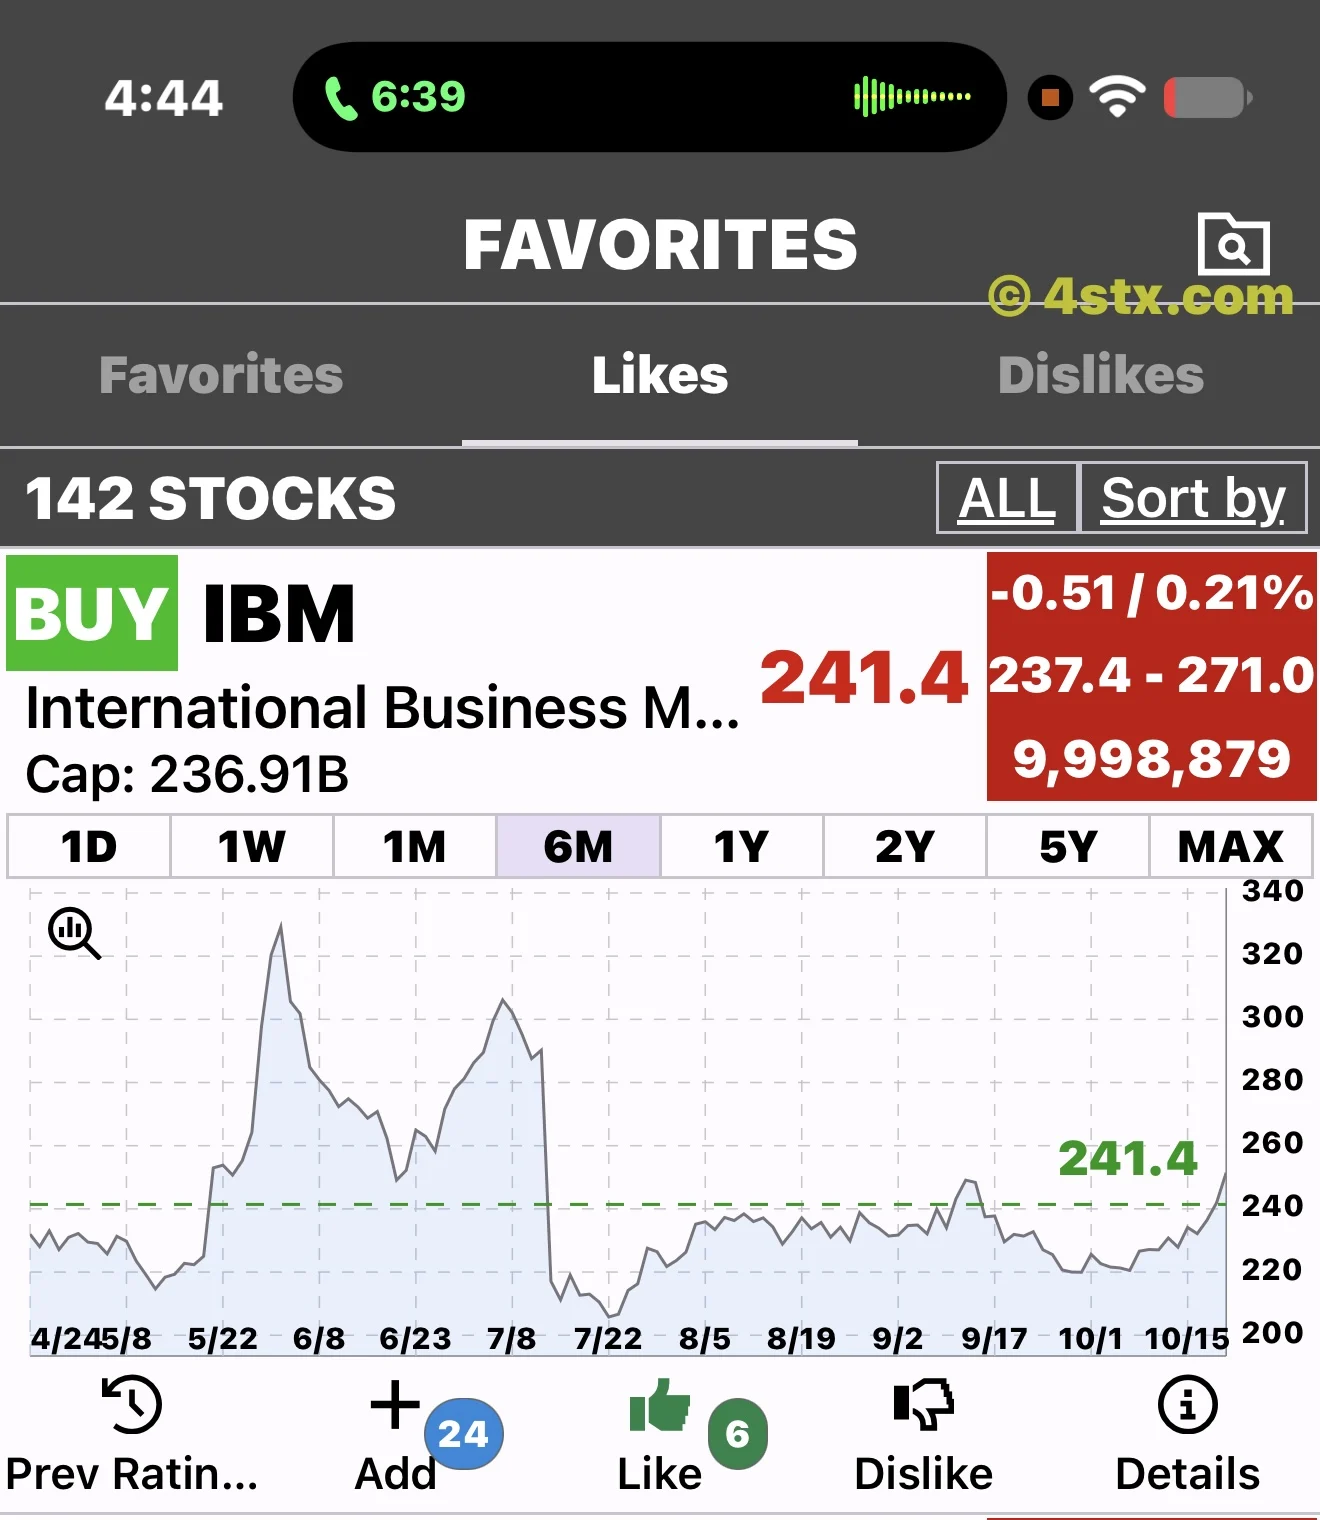
The supplied StockRank screenshots include a six-month view and a one-week view. Both display IBM at $241.4, while later details screens show slightly different snapshot prices. These images record app screens supplied by the owner; they are not live quotations or independently verified closing prices.
The six-month chart provides a wider view of fluctuations. The weekly chart emphasizes a much shorter interval, including a sharp spike and reversal. Neither image alone proves what caused a move. A reader should match the chart window and timestamp to dated reporting before drawing that connection.
The BUY label is part of StockRank’s interface, not this article’s investment recommendation.
Quote details and valuation fields
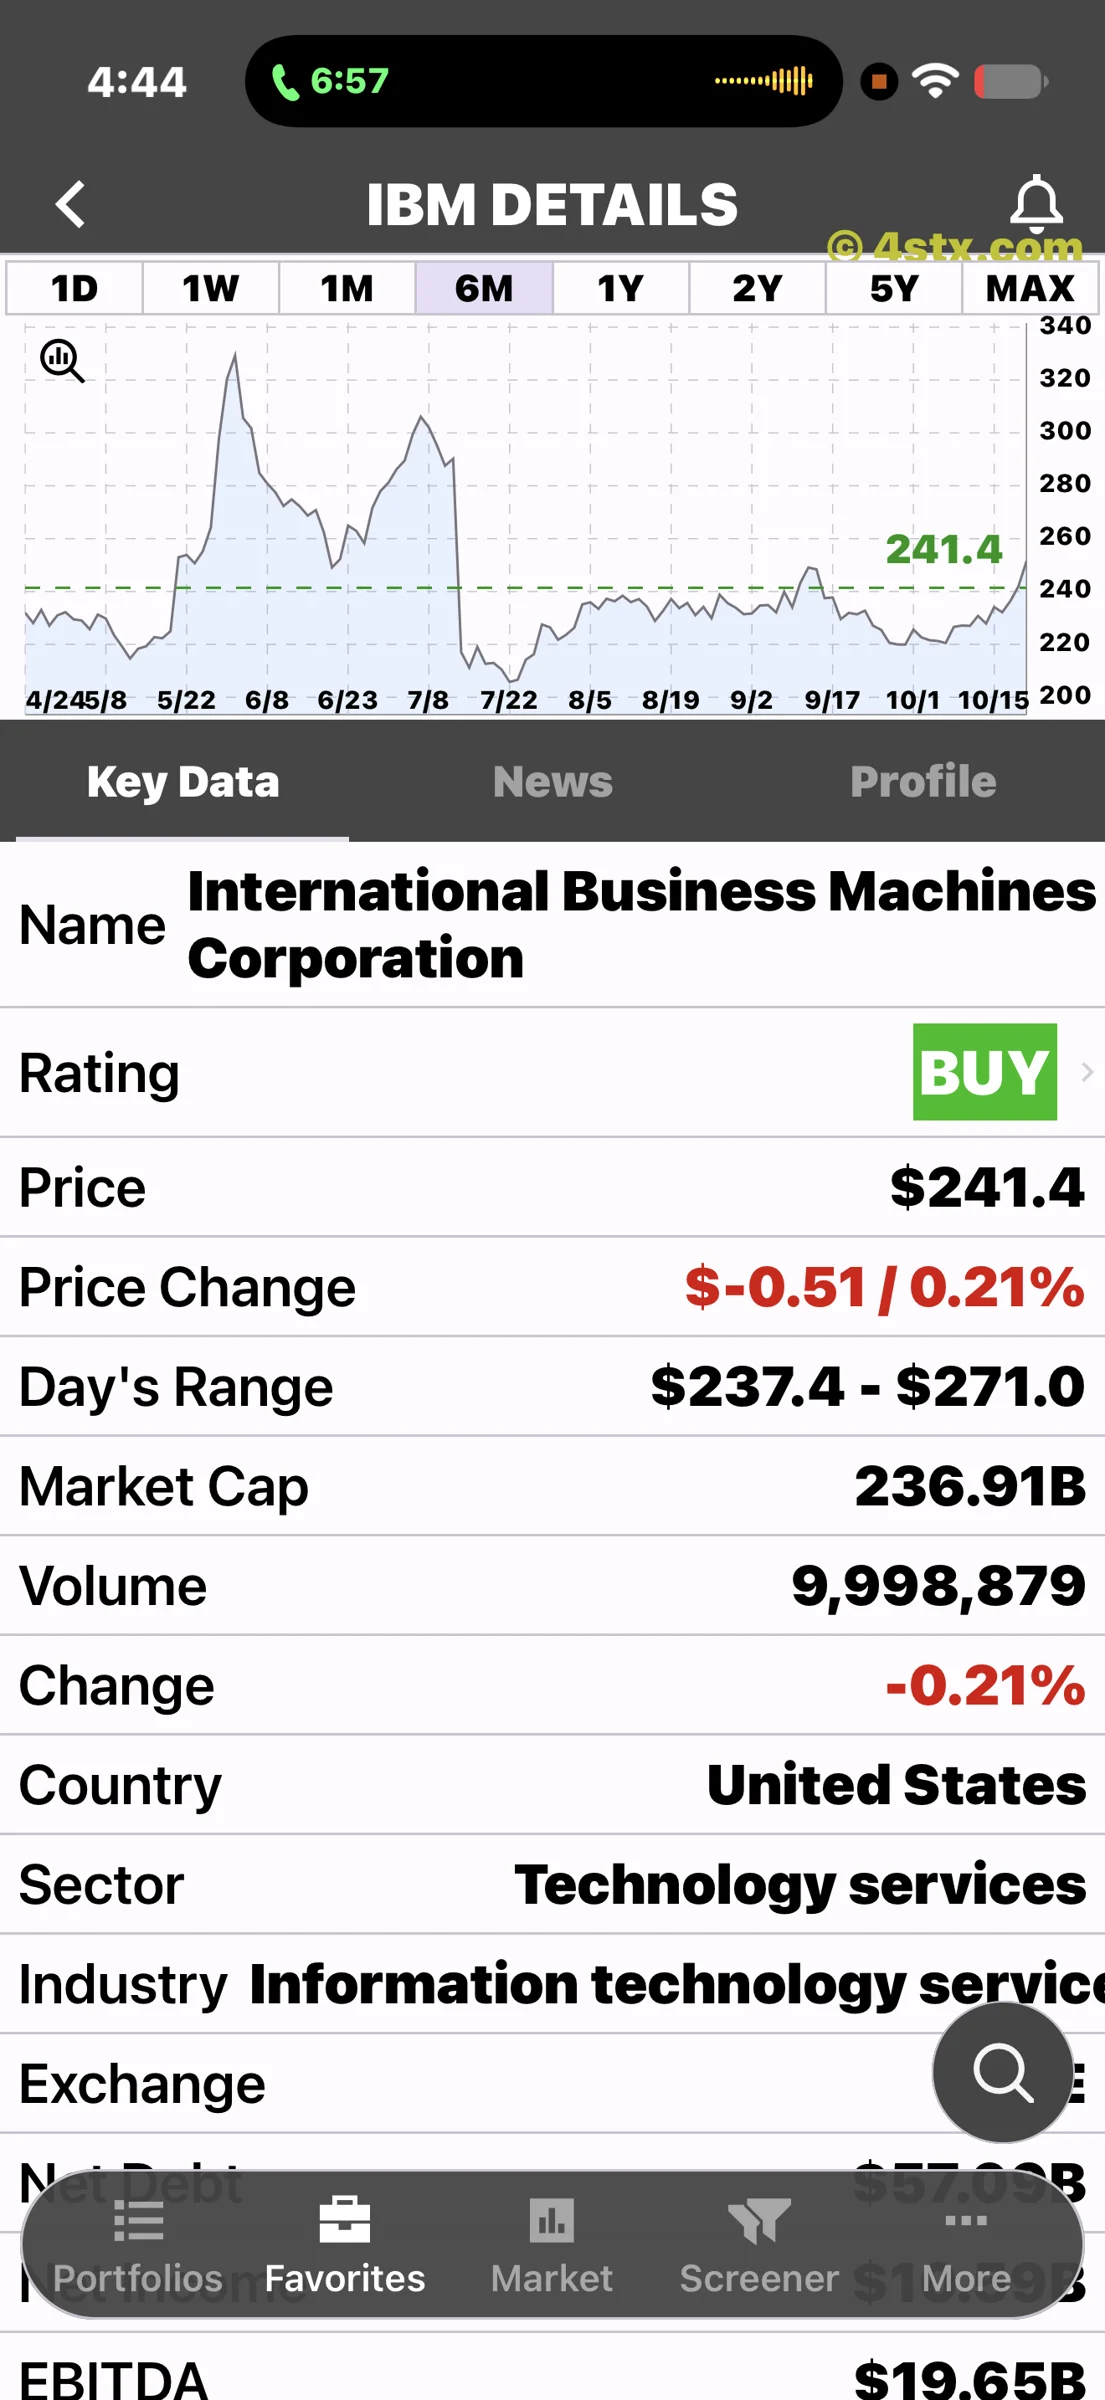
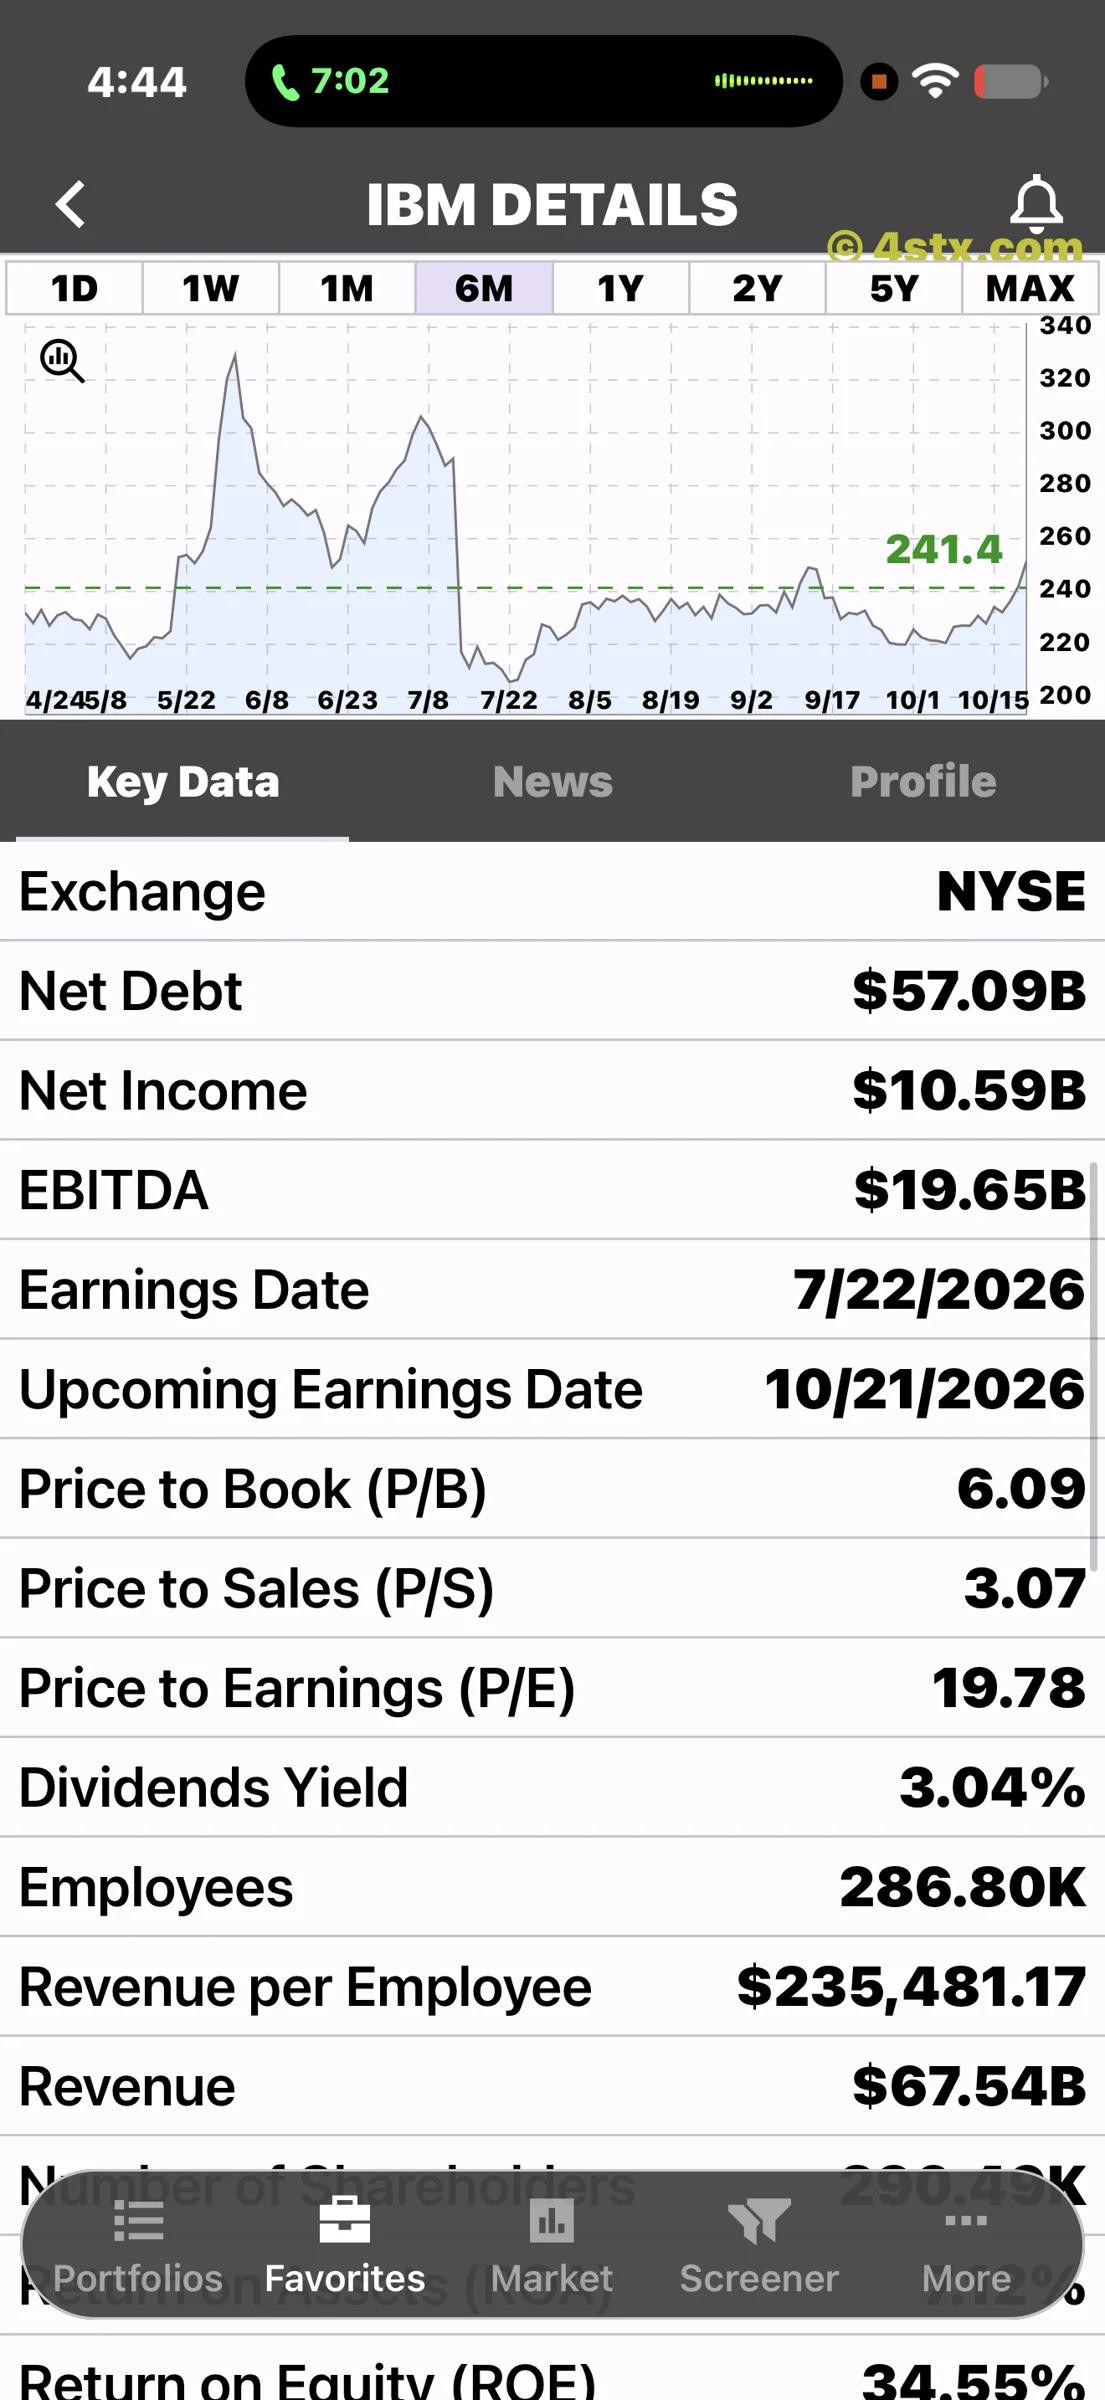
The company-details screenshot displays a $237.4–$271.0 day’s range, market capitalization of $236.91 billion and volume of 9,998,879. Its price-change field shows -$0.51 and a 0.21% decline.
The next financial screen lists net debt of $57.09 billion, net income of $10.59 billion, EBITDA of $19.65 billion and revenue of $67.54 billion. It displays P/E of 19.78, price-to-book of 6.09, price-to-sales of 3.07 and dividend yield of 3.04%.
These fields do not identify themselves as the newly announced quarter. Keep them separate from the dated release. The screen’s “upcoming” earnings entry also remains October 21, illustrating why the original company announcement should be checked alongside the app calendar.
Assets, ranges and performance
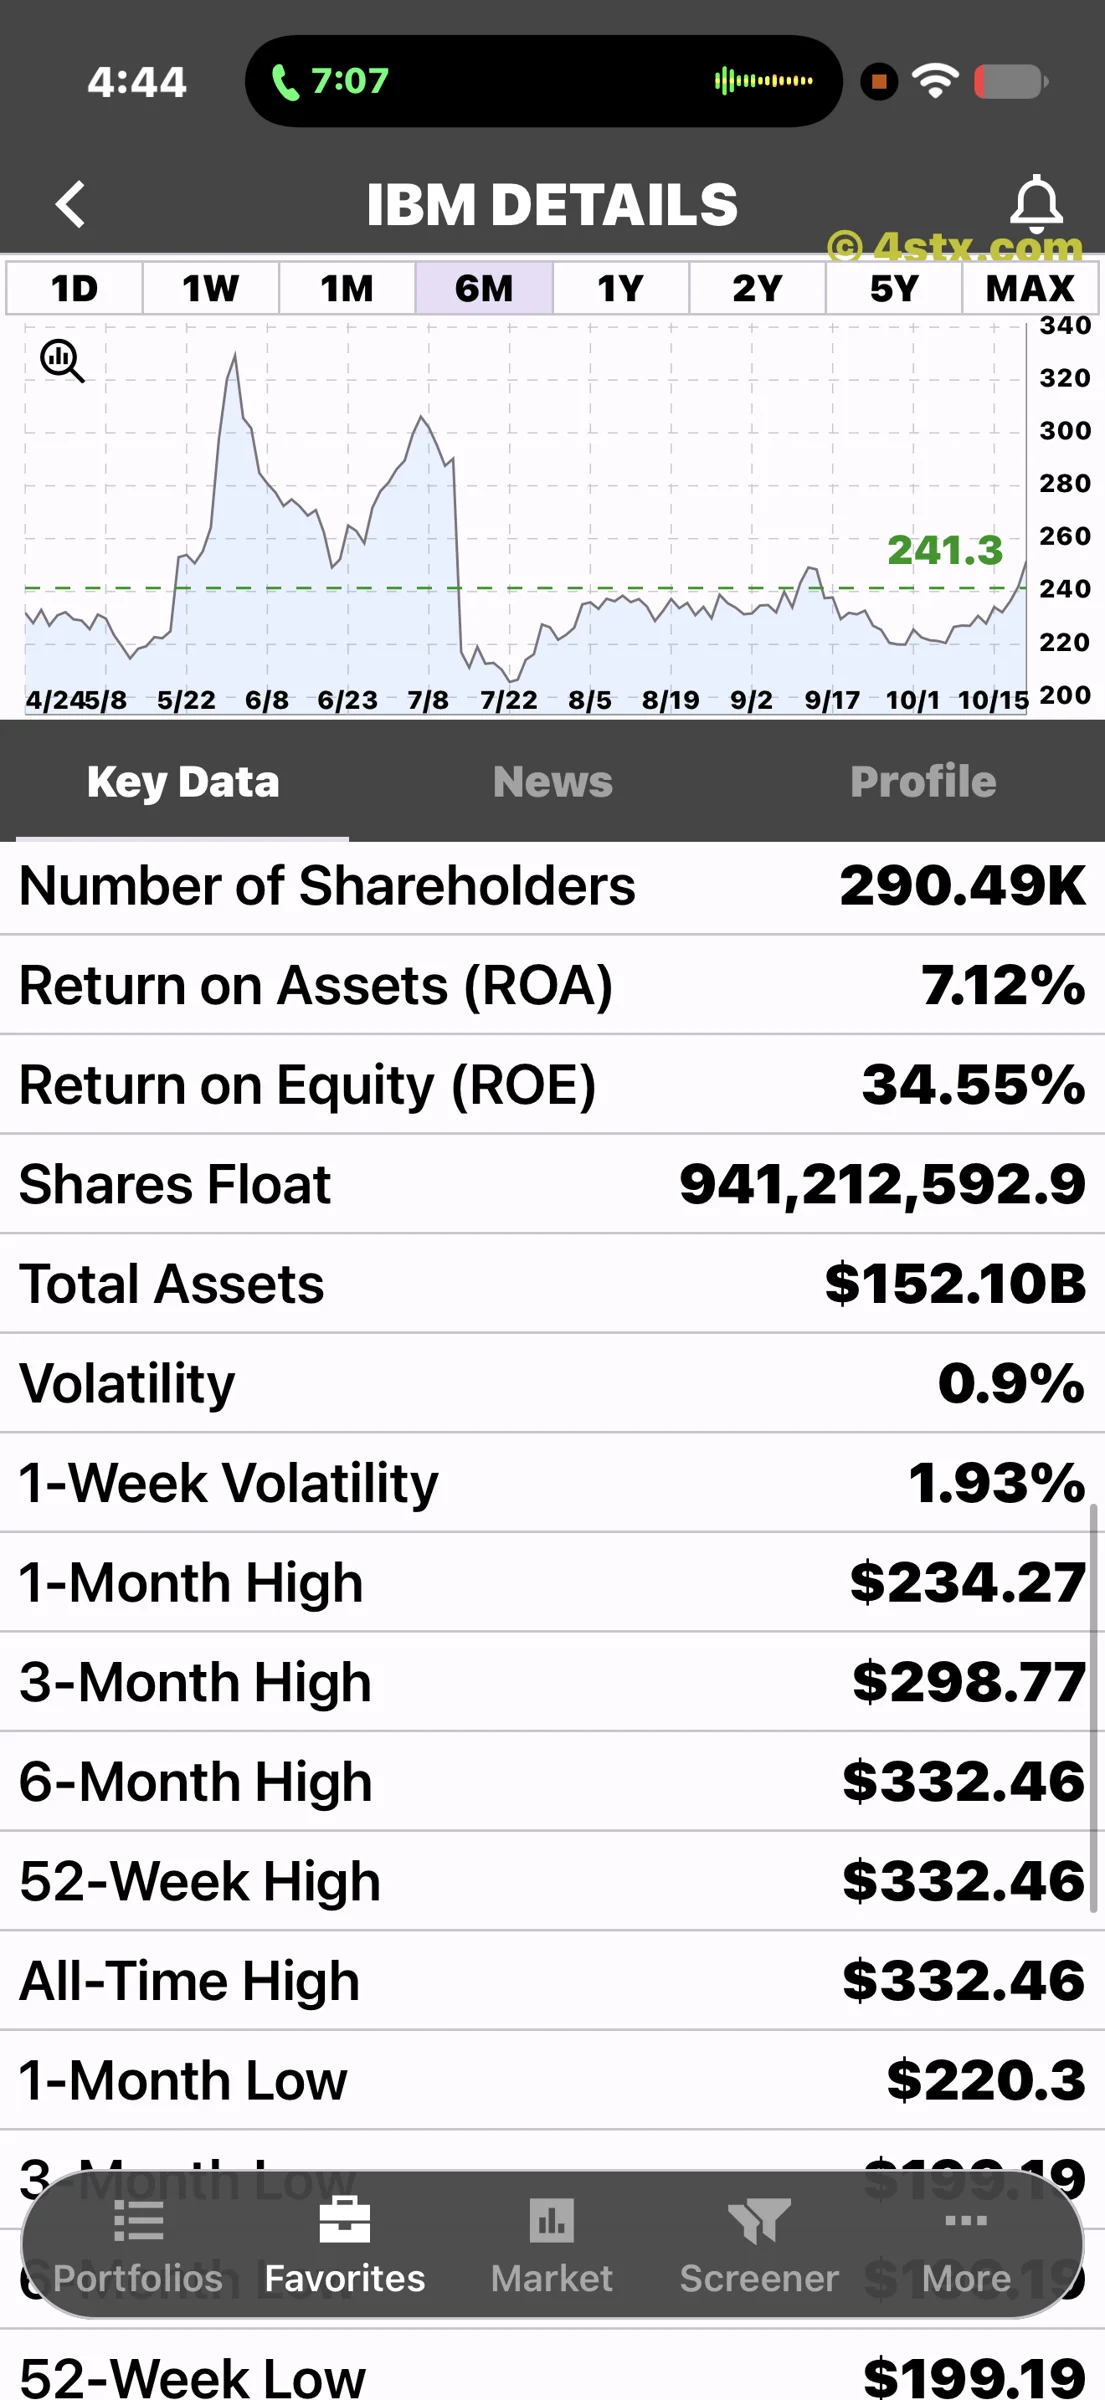
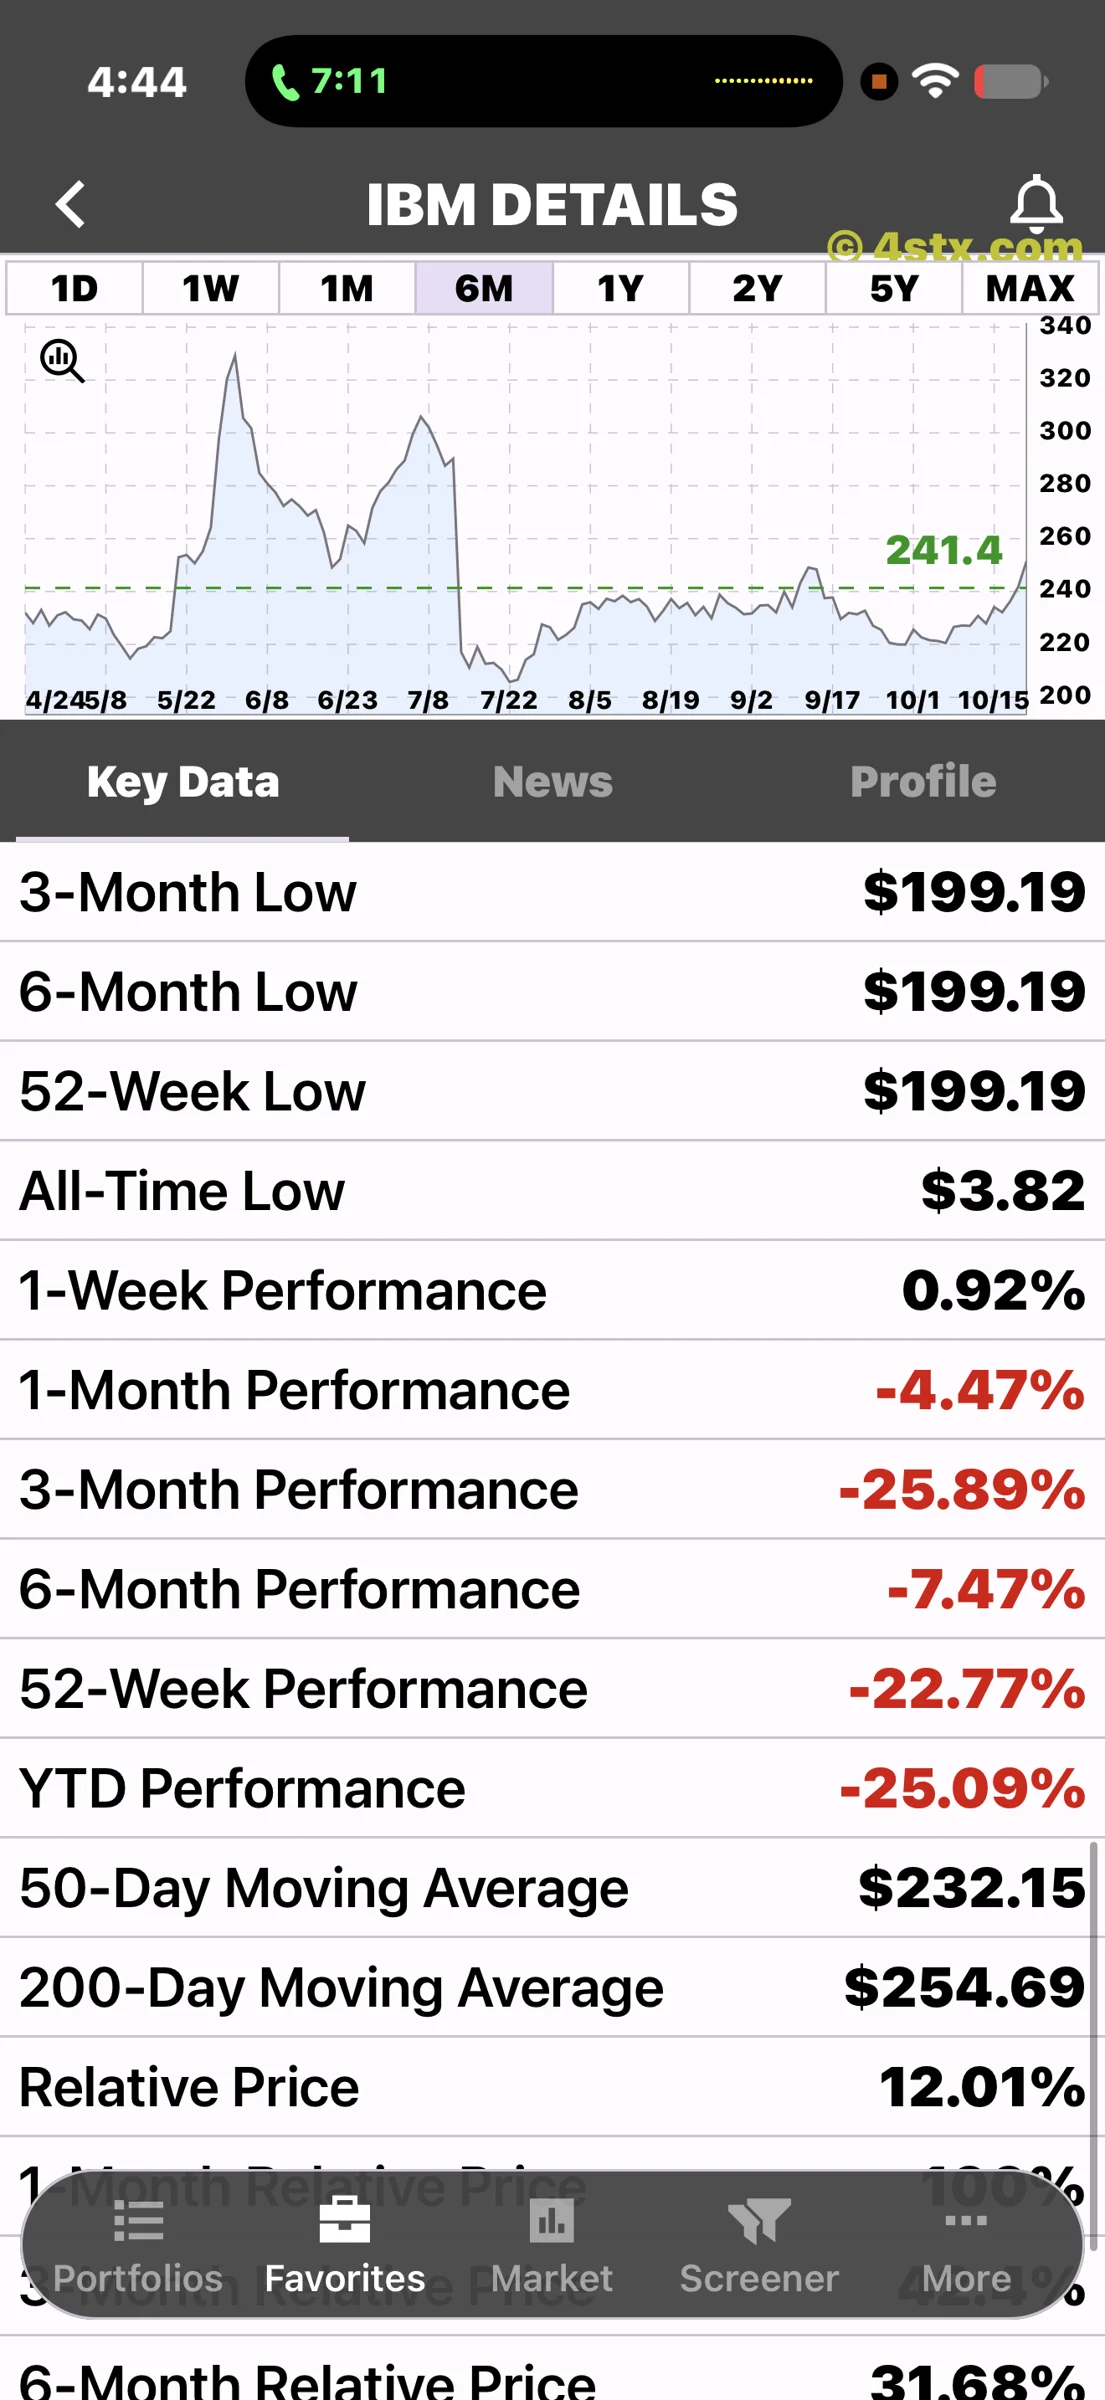
The assets screen shows $152.10 billion in total assets, return on assets of 7.12% and return on equity of 34.55%. Its six-month and 52-week high fields show $332.46. Another screen lists a $199.19 low for several periods.
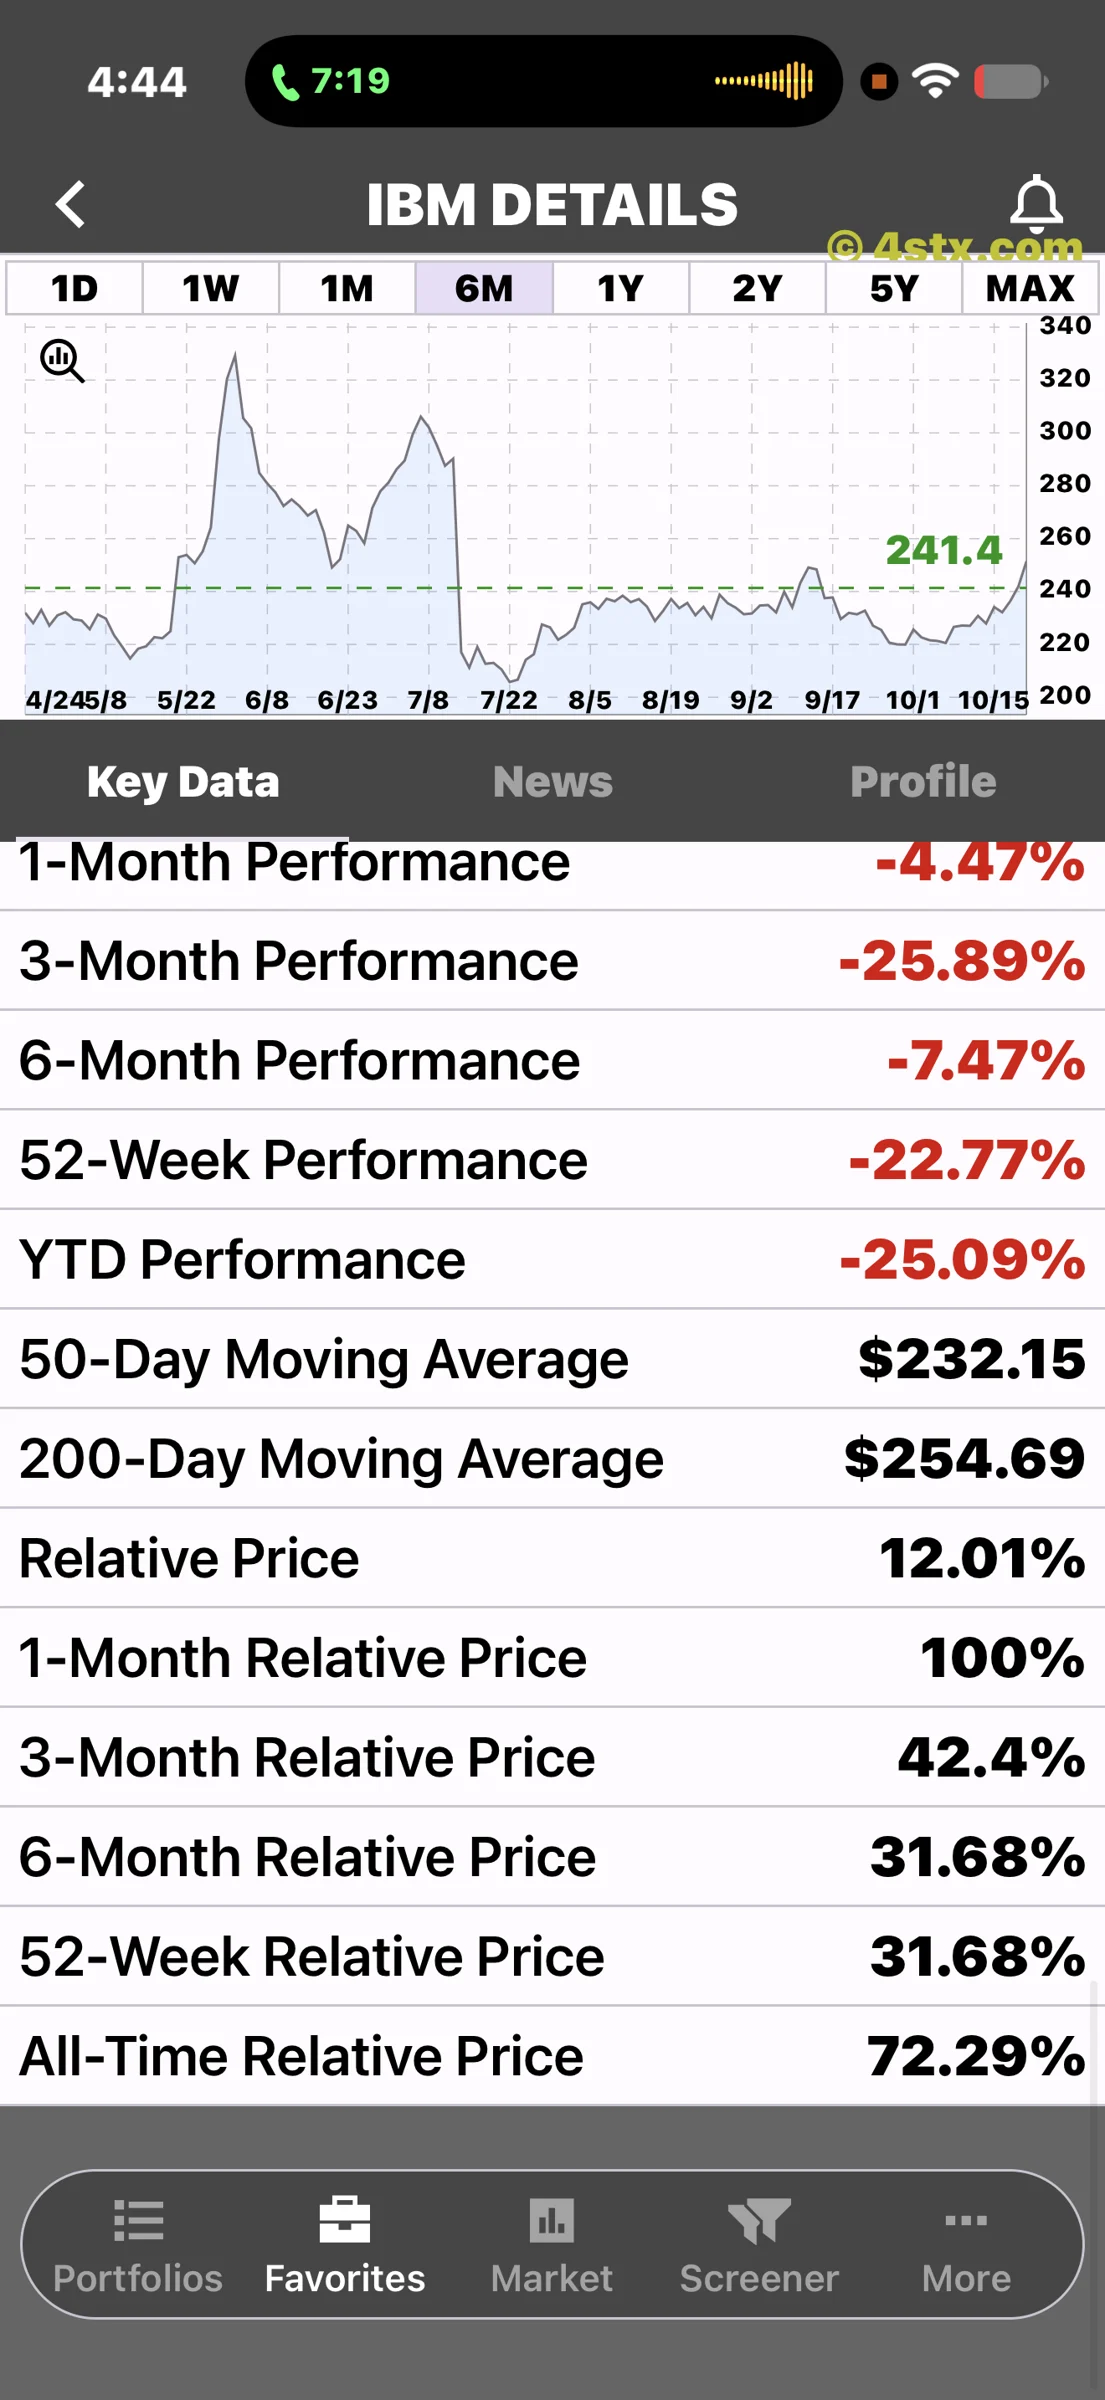
The performance views show one-week performance of 0.92%, one-month performance of -4.47%, three-month performance of -25.89% and six-month performance of -7.47%. The continuation includes 50-day and 200-day moving averages of $232.15 and $254.69.
These displays demonstrate why a time window matters. A positive week can coexist with a negative longer period. Relative-price fields are distinct indicators, not interchangeable measures of investment return. The screenshots do not establish a common update time or calculation method for every field.
The business behind the ticker
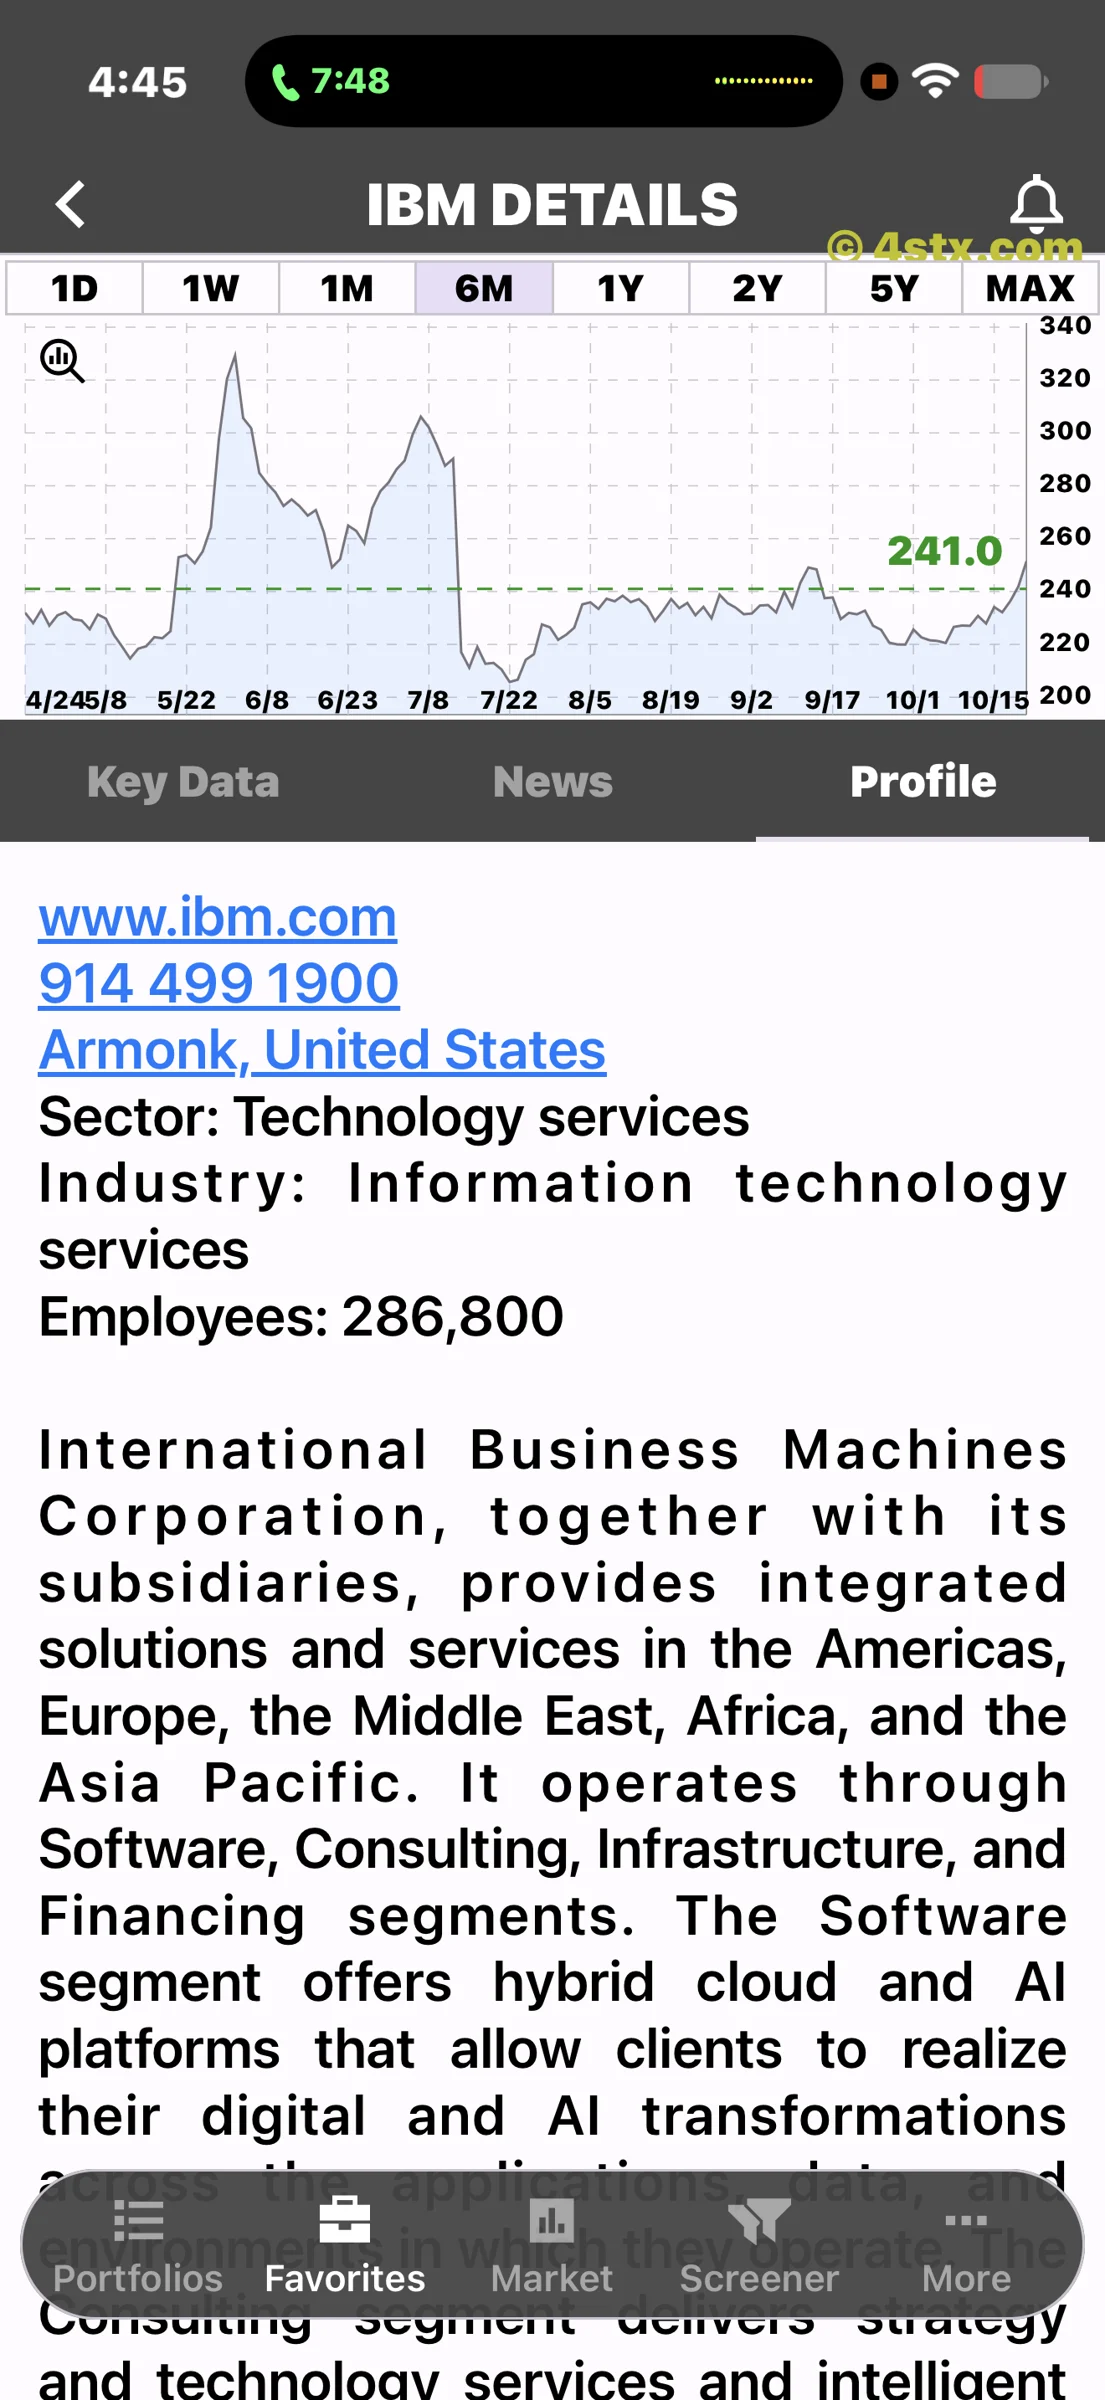
The profile screen describes IBM’s Software, Consulting, Infrastructure and Financing segments and introduces hybrid cloud and AI platforms. It shows Armonk, a company website and a workforce figure of 286,800 as displayed in the app.
That profile helps a reader understand why IBM cannot be evaluated using one technology slogan. The next step is to connect each business with the latest segment reporting, rather than assuming every source of revenue grows at the same rate.
Use the news feed to reach the evidence
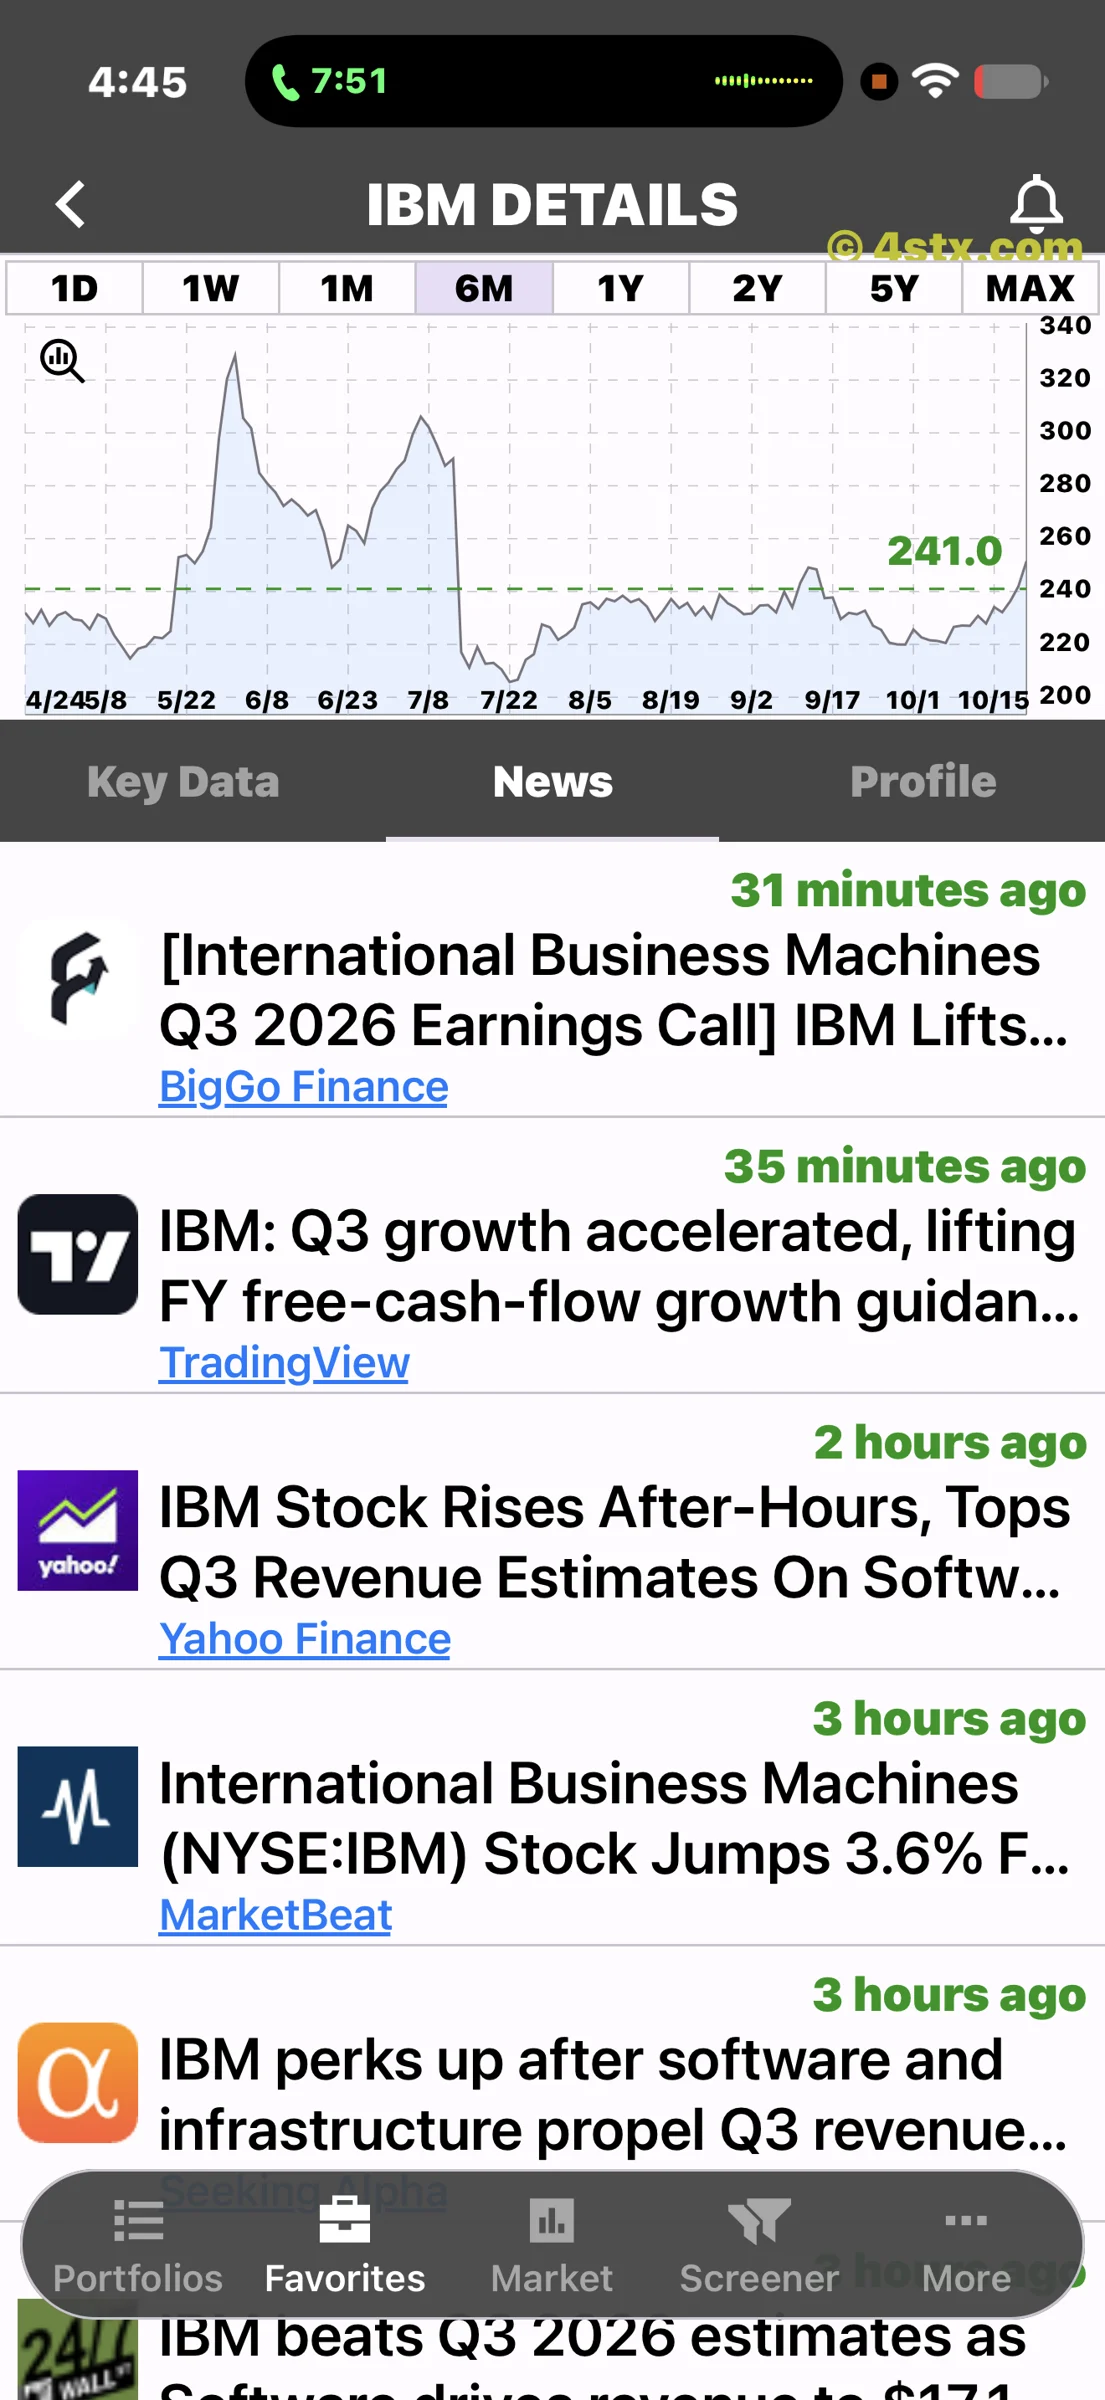
The news screenshot includes earnings and cash-flow headlines from several publishers. It demonstrates the app’s news links, not independent verification of every headline. Relative timestamps such as “31 minutes ago” belong to the capture.
Open the original reporting, check its date and distinguish actual results from forecasts. That habit is more useful than counting how many favorable headlines appear on one screen.
Explore IBM in StockRank
All nine images are authorized StockRank App screenshots: the six-month cover and eight supporting views. StockRank’s chart, details, profile and news panels help connect a ticker with research questions worth investigating. Verified Apple App Store and Google Play download links appear below.
IBM’s latest report offers a practical lesson: follow the sales story, then follow the cash. The two can reinforce each other, but neither should be assumed from the other.