A rising market can benefit more than the investor holding the shares. It can also affect the fees earned by the businesses that advise investors. Wells Fargo’s latest results offer a concrete example of that connection.
Wells Fargo & Company, listed on the NYSE under ticker WFC, reported its third-quarter results on October 13, 2026. Within Wealth and Investment Management, revenue rose 12% from a year earlier. The bank attributed higher investment advisory fees to increased market valuations.
For TasteOfMoney, this is a story about the business surrounding wealth, rather than simply the price of a bank share. A larger client portfolio and a more profitable advisory business are related ideas, but they are not the same measure.
Market valuations can influence advisory income
The earnings release said noninterest income in the wealth segment increased 12%, with higher investment advisory fees driven by market valuations. It also reported growth in net interest income for that segment.
Those details identify more than one source of revenue. They should not be collapsed into a claim that every customer paid a newly increased fee rate.
Imagine a hypothetical advisory account charged at an unchanged annual rate of 0.5%. On $100,000, the simplified annual calculation is $500. On $110,000, it is $550.
That example does not state Wells Fargo’s actual pricing. It shows why fee dollars can rise when the underlying asset value grows, even if the rate stays unchanged. Actual billing terms and account balances would need to be checked separately.
Revenue growth brings a cost question too
Wells Fargo reported wealth-segment noninterest expense rising 9%, citing higher revenue-related compensation, partly offset by efficiency initiatives. Segment net income increased 19% to $603 million.
The combination helps explain why revenue growth alone is not a complete profitability story. A business earns income and incurs expenses in providing the service.
In a hypothetical advisory business, higher revenue might require more compensation or support resources. Alternatively, some costs might remain relatively stable as revenue grows. The resulting profit would depend on the combination.
That is an analytical illustration, not a forecast of Wells Fargo’s future margins. The verified point is that both income and expenses changed in the reported segment.
A bank-wide headline can hide different businesses
Wells Fargo reported company-wide net income of approximately $6.0 billion and diluted earnings of $1.87 per share. Those totals concern the bank as a whole, rather than the wealth segment alone.
Axios’ reporting on the week’s bank results described consumers continuing to spend despite higher costs and noted improving consumer credit quality at Wells Fargo. That supplies a different piece of context from advisory fees.
The two subjects should remain distinct. A wealth-management result does not describe every borrower’s payment performance, and consumer credit trends do not explain every change in advisory revenue.
For readers following WFC, the useful habit is to identify the business being discussed before applying a conclusion to the whole company.
Client wealth and a shareholder’s return are separate
A rise in market values within client accounts does not establish the return earned by someone buying Wells Fargo shares. The customers’ investments and the bank’s own stock are different assets.
Nor does the earnings release establish that every client portfolio increased by the same amount. Individual holdings, transactions and time periods can differ.
This article offers no recommendation to purchase WFC or any advisory service. Its purpose is to explain a reported business mechanism: market values can influence fee income, while costs help determine how much becomes profit.
A reader considering a specific service would still need its own fee schedule and terms. Those have not been independently priced for this article.
StockRank chart context and app downloads
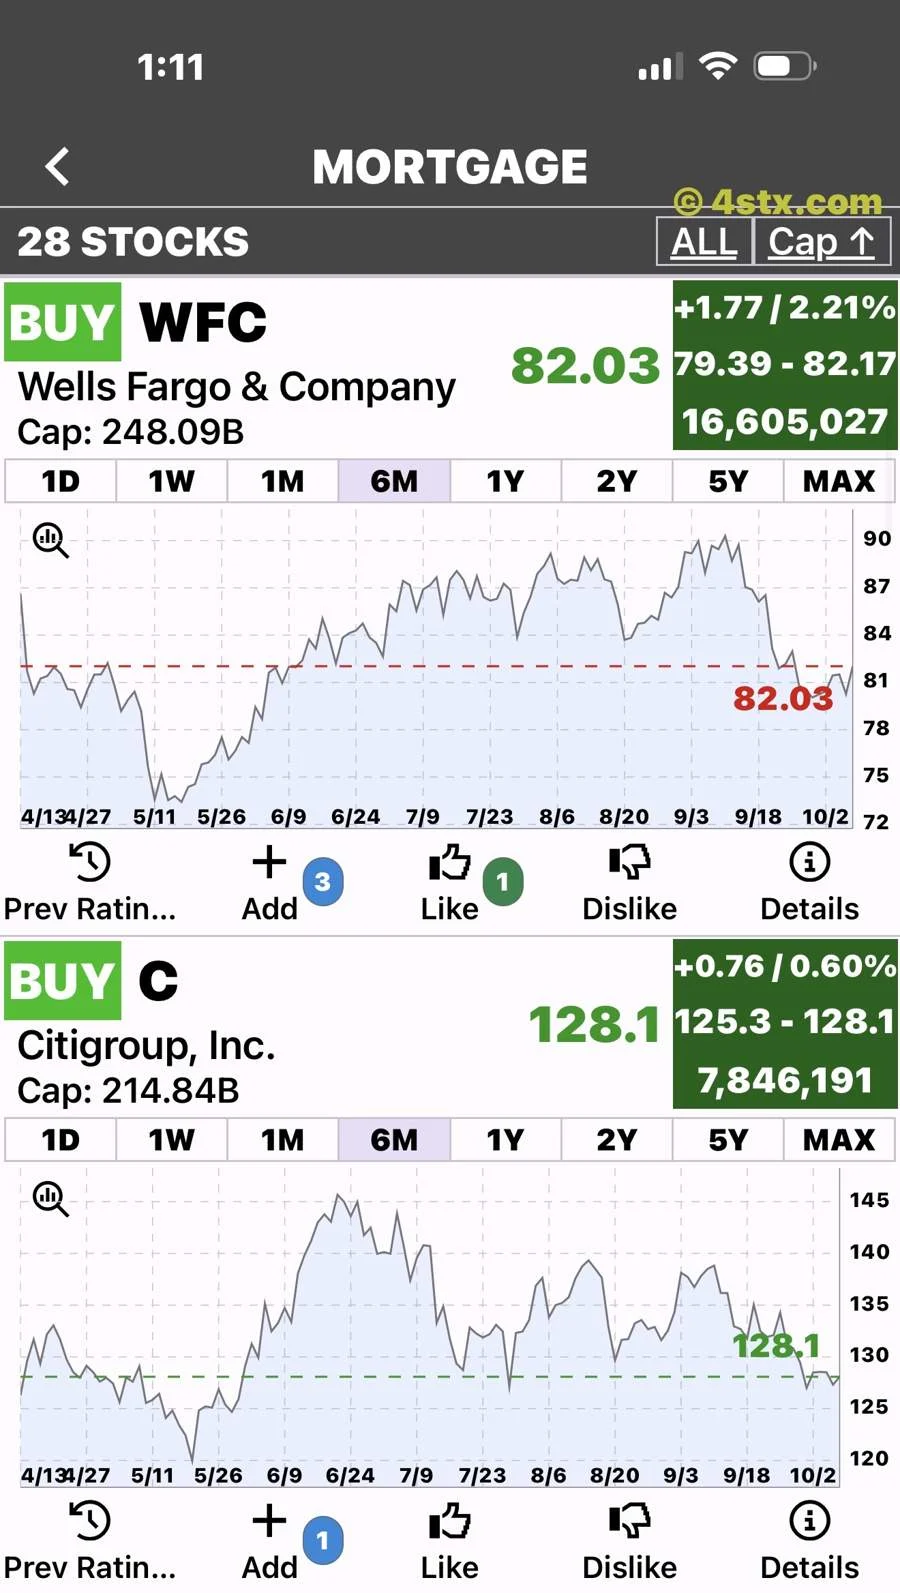
The accompanying screenshot was supplied by the user from StockRank. It shows a six-month Wells Fargo chart above a separate Citigroup chart and carries the visible 4stx.com watermark.
The displayed WFC quote of 82.03 is a historical screenshot reading, not a current October 19 quote or an independently verified closing price. The image was supplied for an earlier article; it does not establish the market’s response to the October 13 results.
StockRank’s trading labels remain the app’s assessments rather than this article’s advice. Readers can use the screen to identify the company and then examine the dated filing for its business results.
Direct links to StockRank for iPhone in the Apple App Store and for Android in Google Play appear below. The app supplies a visual starting point; the verified disclosure explains how the business behind the ticker earns money.